USGS 11264500 MERCED R A HAPPY ISLES BRIDGE NR YOSEMITE CA

PROVISIONAL DATA SUBJECT TO REVISION

Click to hidestation-specific text
Click to visit webcam
Site Webcam
> Rating Information
Available Parameters Available Period
  
2012-03-23  2025-12-12
1988-08-18  2025-12-12
2007-10-01  2025-12-12
2022-12-13  2025-12-12


 (7)
 

  -- or --


Summary of all available data for this site
Instantaneous-data availability statement
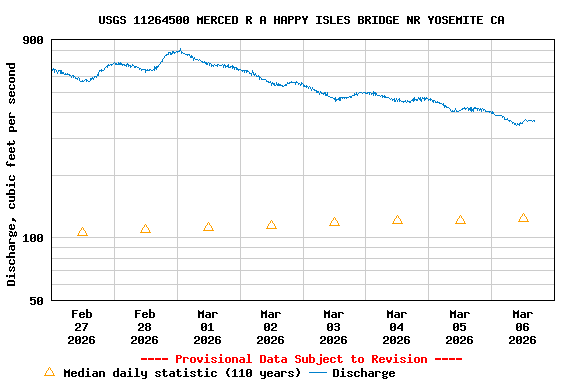

Temperature, water, degrees Celsius

Most recent instantaneous value: 3.6 12-12-2025   10:30 PST
Graph of  Temperature, water, degrees Celsius

Add up to 2 more sites and replot for "Temperature, water, degrees Celsius"

?


Create presentation-quality / stand-alone graph.   Subscribe to WaterAlert      

See this graph on the Monitoring Location Pages


Discharge, cubic feet per second

Most recent instantaneous value: 58.4 12-12-2025   10:30 PST
Graph of  Discharge, cubic feet per second

Add up to 2 more sites and replot for "Discharge, cubic feet per second"

?


Create presentation-quality / stand-alone graph.   Subscribe to WaterAlert      

See this graph on the Monitoring Location Pages


Daily discharge, cubic feet per second -- statistics for Dec 12 based on 110 water years of record more
Min
(1937)
25th
percen-
tile
Median Most Recent
Instantaneous
Value Dec 12
75th
percen-
tile
Mean Max
(1938)
4.90 20 43 58.4 76 78 1700


Gage height, feet

Most recent instantaneous value: 1.78 12-12-2025   10:30 PST
Graph of  Gage height, feet

Add up to 2 more sites and replot for "Gage height, feet"

?


Create presentation-quality / stand-alone graph.   Subscribe to WaterAlert      

See this graph on the Monitoring Location Pages


Stream water level elevation above NAVD 1988, in feet

Most recent instantaneous value: 4022.24 12-12-2025   10:30 PST
Graph of  Stream water level elevation above NAVD 1988, in feet

Add up to 2 more sites and replot for "Stream water level elevation above NAVD 1988, in feet"

?


Create presentation-quality / stand-alone graph.   Subscribe to WaterAlert      

See this graph on the Monitoring Location Pages