USGS 02336240 S.F. PEACHTREE CREEK JOHNSON RD, NEAR ATLANTA, GA

PROVISIONAL DATA SUBJECT TO REVISION

Click to hidestation-specific text
AtlantaDeKalb County The operation of this streamgage is funded in cooperation with the City of Atlanta, Georgia and DeKalb County, Georgia.

This station managed by the South Atlantic WSC Atlanta Field Office.

Available Parameters Available Period
  
2007-10-01  2024-04-16
2003-05-01  2024-04-16
2007-10-01  2024-04-16
2007-10-01  2024-04-16
2007-10-01  2024-04-16
2007-10-01  2024-04-16
2007-10-02  2024-04-16


 (7)
 

  -- or --


Summary of all available data for this site
Instantaneous-data availability statement
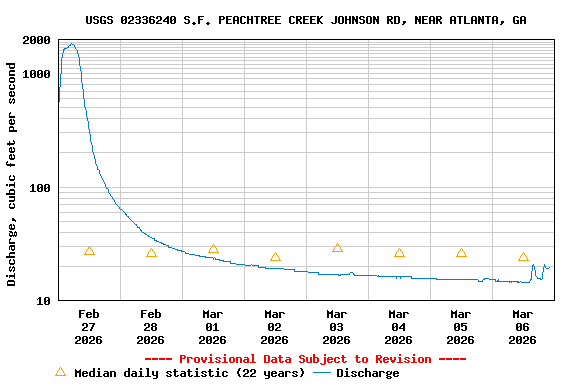
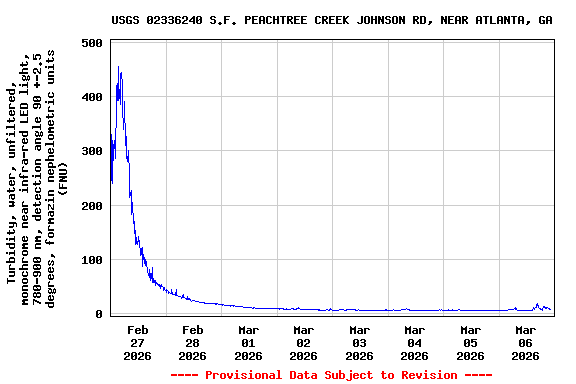

Temperature, water, degrees Celsius

Most recent instantaneous value: 20.7 04-16-2024   18:15 EDT
Graph of

Add up to 2 more sites and replot for "Temperature, water, degrees Celsius"

?


Create presentation-quality / stand-alone graph.   Subscribe to WaterAlert      

See this graph on the Monitoring Location Pages


Discharge, cubic feet per second

Most recent instantaneous value: 19.7 04-16-2024   18:15 EDT
Graph of

Add up to 2 more sites and replot for "Discharge, cubic feet per second"

?


Create presentation-quality / stand-alone graph.   Subscribe to WaterAlert      

See this graph on the Monitoring Location Pages


Daily discharge, cubic feet per second -- statistics for Apr 16 based on 20 water years of record more
Min
(2012)
25th
percen-
tile
Most Recent
Instantaneous
Value Apr 16
Median 75th
percen-
tile
Mean Max
(2011)
8.81 18 19.7 20 27 43 297


Gage height, feet

Most recent instantaneous value: 3.58 04-16-2024   18:15 EDT
Graph of

Add up to 2 more sites and replot for "Gage height, feet"

?


Create presentation-quality / stand-alone graph.   Subscribe to WaterAlert      

See this graph on the Monitoring Location Pages


Specific conductance, water, unfiltered, microsiemens per centimeter at 25 degrees Celsius

Most recent instantaneous value: 135 04-16-2024   18:15 EDT
Graph of

Add up to 2 more sites and replot for "Specific conductance, water, unfiltered, microsiemens per centimeter at 25 degrees Celsius"

?


Create presentation-quality / stand-alone graph.   Subscribe to WaterAlert      

See this graph on the Monitoring Location Pages


Dissolved oxygen, water, unfiltered, milligrams per liter

Most recent instantaneous value: 9.0 04-16-2024   18:15 EDT
Graph of

Add up to 2 more sites and replot for "Dissolved oxygen, water, unfiltered, milligrams per liter"

?


Create presentation-quality / stand-alone graph.   Subscribe to WaterAlert      

See this graph on the Monitoring Location Pages


pH, water, unfiltered, field, standard units

Most recent instantaneous value: 7.4 04-16-2024   18:15 EDT
Graph of

Add up to 2 more sites and replot for "pH, water, unfiltered, field, standard units"

?


Create presentation-quality / stand-alone graph.   Subscribe to WaterAlert      

See this graph on the Monitoring Location Pages


Turbidity, water, unfiltered, monochrome near infra-red LED light, 780-900 nm, detection angle 90 +-2.5 degrees, formazin nephelometric units (FNU)

Most recent instantaneous value: 3.5 04-16-2024   18:15 EDT
Graph of

Add up to 2 more sites and replot for "Turbidity, water, unfiltered, monochrome near infra-red LED light, 780-900 nm, detection angle 90 +-2.5 degrees, formazin nephelometric units (FNU)"

?


Create presentation-quality / stand-alone graph.   Subscribe to WaterAlert      

See this graph on the Monitoring Location Pages