USGS 16212601 Waikele Str at Wheeler Field, Oahu, HI

PROVISIONAL DATA SUBJECT TO REVISION

This station managed by the Pacific Islands WSC - Honolulu Oahu HI.

Available Parameters Available Period
  
2007-10-01  2026-03-20
2007-10-01  2026-03-20
2024-11-05  2026-03-20
2025-11-20  2026-03-20


 (31)
 

  -- or --


Summary of all available data for this site
Instantaneous-data availability statement


Discharge, cubic feet per second

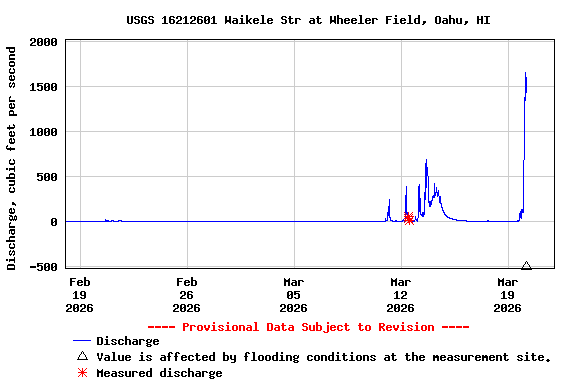
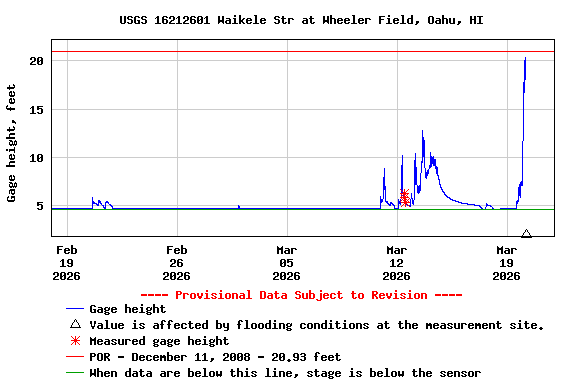
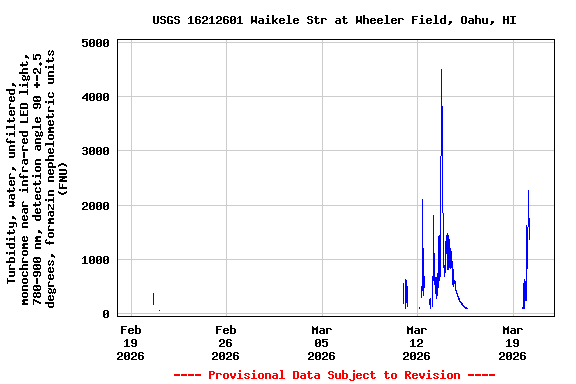
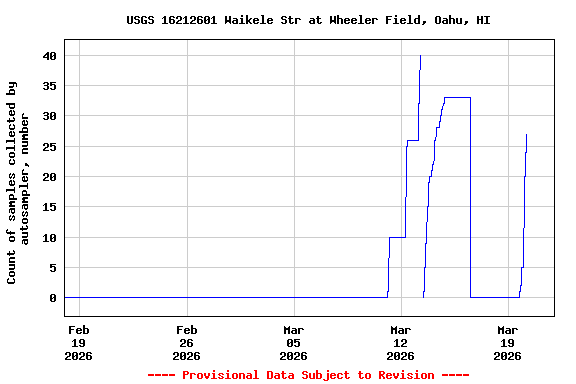
Most recent instantaneous value: Fld 03-20-2026   04:20 HST
Graph of  Discharge, cubic feet per second

Add up to 2 more sites and replot for "Discharge, cubic feet per second"

?


Create presentation-quality / stand-alone graph.   Subscribe to WaterAlert      

See this graph on the Monitoring Location Pages


Gage height, feet

Most recent instantaneous value: Fld 03-20-2026   04:35 HST
Graph of  Gage height, feet

Add up to 2 more sites and replot for "Gage height, feet"

?


Create presentation-quality / stand-alone graph.   Subscribe to WaterAlert      

See this graph on the Monitoring Location Pages


Turbidity, water, unfiltered, monochrome near infra-red LED light, 780-900 nm, detection angle 90 +-2.5 degrees, formazin nephelometric units (FNU)

Most recent instantaneous value: 1510 03-20-2026   03:55 HST
Graph of  Turbidity, water, unfiltered, monochrome near infra-red LED light, 780-900 nm, detection angle 90 +-2.5 degrees, formazin nephelometric units (FNU)

Add up to 2 more sites and replot for "Turbidity, water, unfiltered, monochrome near infra-red LED light, 780-900 nm, detection angle 90 +-2.5 degrees, formazin nephelometric units (FNU)"

?


Create presentation-quality / stand-alone graph.   Subscribe to WaterAlert      

See this graph on the Monitoring Location Pages


Count of samples collected by autosampler, number

Most recent instantaneous value: 27 03-20-2026   03:55 HST
Graph of  Count of samples collected by autosampler, number

Add up to 2 more sites and replot for "Count of samples collected by autosampler, number"

?


Create presentation-quality / stand-alone graph.   Subscribe to WaterAlert      

See this graph on the Monitoring Location Pages