USGS 05412500 Turkey River at Garber, IA

PROVISIONAL DATA SUBJECT TO REVISION

Click to hidestation-specific text

> Site Information

> Images

> National Weather Service River Forecast

Funding For This Site Provided By:

Link to Upstream Gage

Iowa WSC Gage Network

Link to Downstream Gage


This station managed by the Iowa City Field Office.

Available Parameters Available Period
  
2012-05-30  2024-03-18
1990-10-01  2024-03-18
2007-10-01  2024-03-18
2018-03-27  2024-03-18
2018-03-27  2024-03-18
2012-05-09  2024-03-18


 (7)
 

  -- or --


Summary of all available data for this site
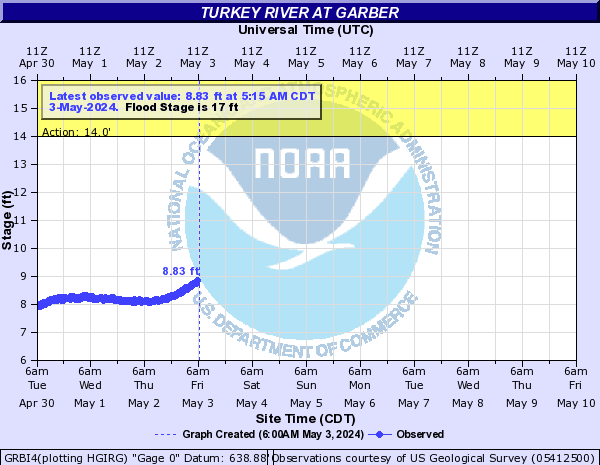
Instantaneous-data availability statement


Temperature, water, degrees Celsius

Most recent instantaneous value: 6.3 03-18-2024   21:15 CDT
Graph of  Temperature, water, degrees Celsius

Add up to 2 more sites and replot for "Temperature, water, degrees Celsius"

?


Create presentation-quality / stand-alone graph.   Subscribe to WaterAlert      

See this graph on the Monitoring Location Pages


Discharge, cubic feet per second

Most recent instantaneous value: 313 03-18-2024   21:15 CDT
Graph of  Discharge, cubic feet per second

Add up to 2 more sites and replot for "Discharge, cubic feet per second"

?


Create presentation-quality / stand-alone graph.   Subscribe to WaterAlert      

See this graph on the Monitoring Location Pages


Daily discharge, cubic feet per second -- statistics for Mar 18 based on 103 water years of record more
Min
(1959)
Most Recent
Instantaneous
Value Mar 18
25th
percen-
tile
Median Mean 75th
percen-
tile
Max
(1986)
150 313 650 1320 2160 3220 12500


Gage height, feet

Most recent instantaneous value: 5.87 03-18-2024   21:15 CDT
Graph of  Gage height, feet

Add up to 2 more sites and replot for "Gage height, feet"

?


Create presentation-quality / stand-alone graph.   Subscribe to WaterAlert      

See this graph on the Monitoring Location Pages


Phosphorus, water, unfiltered, milligrams per liter as phosphorus
 
-- Data temporarily unavailable for the time period specified --

Turbidity, water, unfiltered, monochrome near infra-red LED light, 780-900 nm, detector angles at 90 +-2.5 degrees and 0-45 degrees, ratiometric correction, FBRU
 
-- Data temporarily unavailable for the time period specified --


Nitrate plus nitrite, water, in situ, milligrams per liter as nitrogen

Most recent instantaneous value: 2.7 03-18-2024   21:15 CDT
Graph of  Nitrate plus nitrite, water, in situ, milligrams per liter as nitrogen

Add up to 2 more sites and replot for "Nitrate plus nitrite, water, in situ, milligrams per liter as nitrogen"

?


Create presentation-quality / stand-alone graph.   Subscribe to WaterAlert      

See this graph on the Monitoring Location Pages