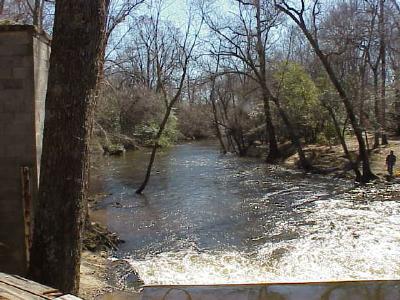
LOCATION.--Lat 38°59'49.9", long 75°47'08.9",
   Caroline County, MD, Hydrologic Unit 02060005, on right bank at highway bridge (removed),
   0.1 mi upstream from Gravelly Branch, 2.0 mi northeast of Greensboro, and 60 mi upstream
   from mouth.
DRAINAGE AREA.--113 mi2.
PERIOD OF RECORD.--January 1948 to current year.
REVISIONS HISTORY.--WSP 1622: 1948. WDR MD-DE-79-1: 1961(P).
GAGE.--Water-stage recorder, concrete control and crest-stage gage.  Datum of gage is 2.73 ft
   above North American Vertical Datum of 1988.
REMARKS.--Diversions for irrigation of about 500 acres, upstream from station. U.S. Geological
   Survey satellite data-collection platform at station.
EXTREMES FOR PERIOD OF RECORD.--Maximum discharge, 8,880 ft3/s, Aug. 28, 2011,
   gage height, 17.96 ft (from floodmark); minimum discharge, 0.26 ft3/s,  Aug. 19, 20, 2002.
EXTREMES OUTSIDE PERIOD OF RECORD.--Flood in 1935 is believed to have been higher than that of
   Aug. 4, 1967, from information by local residents.
COOPERATION.--Funding for the operation of this station is provided by the Maryland Department
   of Natural Resources, and the U.S Geological Survey.

