LOCATION.--Lat 39°11'31.9", long 77°00'15.8", Montgomery County, MD, Hydrologic Unit 02060006,
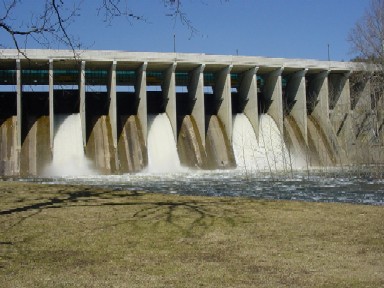
on right bank at Brighton Dam, 500 ft downstream from Triadelphia Reservoir, 1.3 mi east of Brighton,
and 92 mi upstream from mouth.
DRAINAGE AREA.--78.6 mi2.
PERIOD OF RECORD.--October 1980 to current year.
REVISIONS HISTORY.--https://waterdata.usgs.gov/nwis/dv/?site_no=01591610: 2013.
GAGE.--Water-stage recorder, crest-stage gage, and concrete control. Datum of gage is 302.98 ft above North
American Vertical Datum of 1988. June 1978 to October 1980, nonrecording gage 300 ft upstream on
left bank at different gage datum.
REMARKS.--Flow completely regulated by Triadelphia Reservoir, 500 ft upstream, usable capacity,
6,200,000,000 gal; no dead storage. U.S. Geological Survey satellite data-collection platform at station.
Water-quality records for some prior periods have been collected at this location.
EXTREMES FOR PERIOD OF RECORD.--Maximum discharge, 8,600 ft³/s, Jan. 31, 2013, gage height, 11.88 ft;
minimum discharge, 0.88 ft³/s, Feb. 29, 2012.
EXTREMES OUTSIDE PERIOD OF RECORD.--Flood of June 22, 1972 reached a discharge of 17,800 ft3/s.
Data provided by Washington Suburban Sanitary Commission.
COOPERATION.--Funding for the operation of this station is provided by the Washington Suburban Sanitary
Commission.

