USGS 03076600 BEAR CREEK AT FRIENDSVILLE, MD

PROVISIONAL DATA SUBJECT TO REVISION

Click to hidestation-specific text
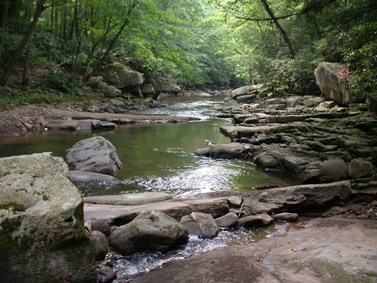
LOCATION.--Lat 39°39'22.1", long 79°23'38.8", Garrett County, Hydrologic Unit 05020006,
   on right bank 0.2 mi downstream from bridge on Accident-Friendsville Road, 0.6 mi downstream
   from South Branch Bear Creek, 0.8 mi southeast of Friendsville, and 1.2 mi upstream from
   mouth.
DRAINAGE AREA.--48.9 mi2.
PERIOD OF RECORD.--October 1964 to current year.
REVISIONS HISTORY.--WDR MD-DE-94-1: 1993.
GAGE.--Water-stage recorder and crest-stage gage. Datum of gage is 1,550.83 ft above North 
   American Vertical Datum of 1988.
REMARKS.--U.S. Geological Survey satellite data-collection platform at station.
EXTREMES FOR PERIOD OF RECORD.--Maximum discharge, 4,650 ft3/s, Sept. 14, 1971, gage height, 9.60 ft;
   minimum discharge 1.5 ft3/s, Sept. 12, 1966.
COOPERATION.--Funding for the operation of this station is provided by the Maryland Department of
   Transportation, and the U.S. Geological Survey.
Boating safety tips
This station managed by the MD-DE-DC Water Science Center Frostburg office.

Available Parameters Available Period
  
1991-10-01  2024-04-19
2007-10-01  2024-04-19


 (7)
 

  -- or --


Summary of all available data for this site
Instantaneous-data availability statement


Discharge, cubic feet per second

Most recent instantaneous value: 85.9 04-19-2024   02:30 EDT
Graph of  Discharge, cubic feet per second

Add up to 2 more sites and replot for "Discharge, cubic feet per second"

?


Create presentation-quality / stand-alone graph.   Subscribe to WaterAlert      

See this graph on the Monitoring Location Pages


Daily discharge, cubic feet per second -- statistics for Apr 19 based on 59 water years of record more
Min
(2012)
25th
percen-
tile
Most Recent
Instantaneous
Value Apr 19
Median Mean 75th
percen-
tile
Max
(2011)
34.6 59 85.9 106 131 170 562


Gage height, feet

Most recent instantaneous value: 2.23 04-19-2024   02:30 EDT
Graph of  Gage height, feet

Add up to 2 more sites and replot for "Gage height, feet"

?


Create presentation-quality / stand-alone graph.   Subscribe to WaterAlert      

See this graph on the Monitoring Location Pages