PROVISIONAL DATA SUBJECT TO REVISION
Click to hidestation-specific text
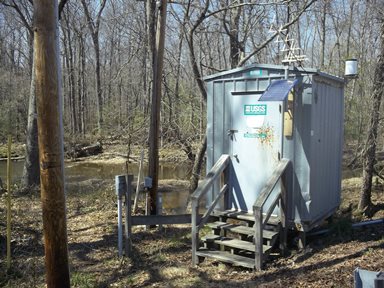
LOCATION.-- Lat 38°35'46.1", long 77°03'21.7", Charles County, MD, Hydrologic Unit 02070011,
   on bank at left downstream side of bridge on State Highway 227, 30 ft downstream from Old
   Womans Run, 1.2 mi southeast of Pomonkey, and 12.6 mi upstream from mouth.
DRAINAGE AREA.--54.8 mi2.
PERIOD OF RECORD.--November 1949 to September 1972. Annual maximums, water years 1973-86.
   January 2001 to current year.
REVISIONS HISTORY.--WDR MD-DE-DC-02-1. https://waterdata.usgs.gov/nwis/dv/?site_no=01658000: 2018-2019.
   https://nwis.waterdata.usgs.gov/md/nwis/peak?site_no=01658000: 2018-2019.
GAGE.--Water-stage recorder, crest-stage gage and concrete control. Datum of gage is 39.76 ft
   above North American Vertical Datum of 1988.
REMARKS.--Low flow affected by ground-water diversions from municipal well fields at Waldorf and
   St. Charles. U.S. Geological Survey satellite data-collection platform at station.
EXTREMES FOR PERIOD OF RECORD.--Maximum discharge, 9,300 ft3/s, Aug. 13, 1955, gage height, 7.52 ft;
   maximum gage height, 8.08 ft, Aug. 4, 2020; minimum discharge, 0.0 ft3/s, no flow at times
   in each year.
COOPERATION.--Funding for the operation of this station is provided by the Maryland Geological
   Survey and the U.S. Geological Survey.
| Boating safety tips |
Summary of all available data for this site
Instantaneous-data availability statement

