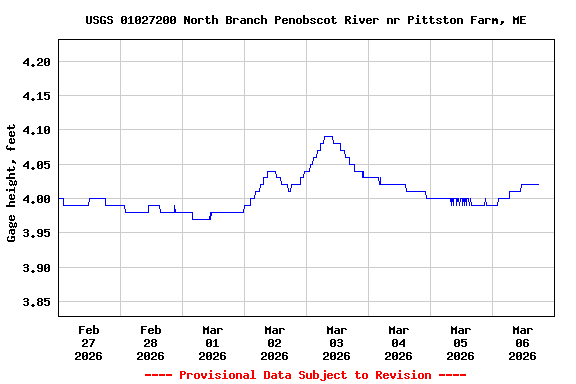
Most recent instantaneous value: Ice 03-06-2026 10:45 EST
See this graph on the Monitoring Location Pages
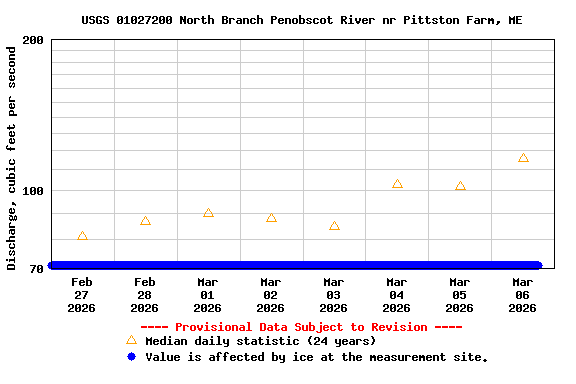
| Most Recent Instantaneous Value Mar 6 | Min (2003) | 25th percen- tile | Median | Mean | 75th percen- tile | Max (2024) |
|---|---|---|---|---|---|---|
| -- unavailable -- | 27.7 | 56 | 116 | 187 | 230 | 796 |