USGS 05316500 REDWOOD RIVER NEAR REDWOOD FALLS, MN

PROVISIONAL DATA SUBJECT TO REVISION

Click to hidestation-specific text
Operated in cooperation with the
Minnesota Department of Natural Resources Logo Minnesota Department of Natural Resources - Ecological and Water Resources Division

Additional Information:

National Weather Service Logo National Weather Service Forecast Page

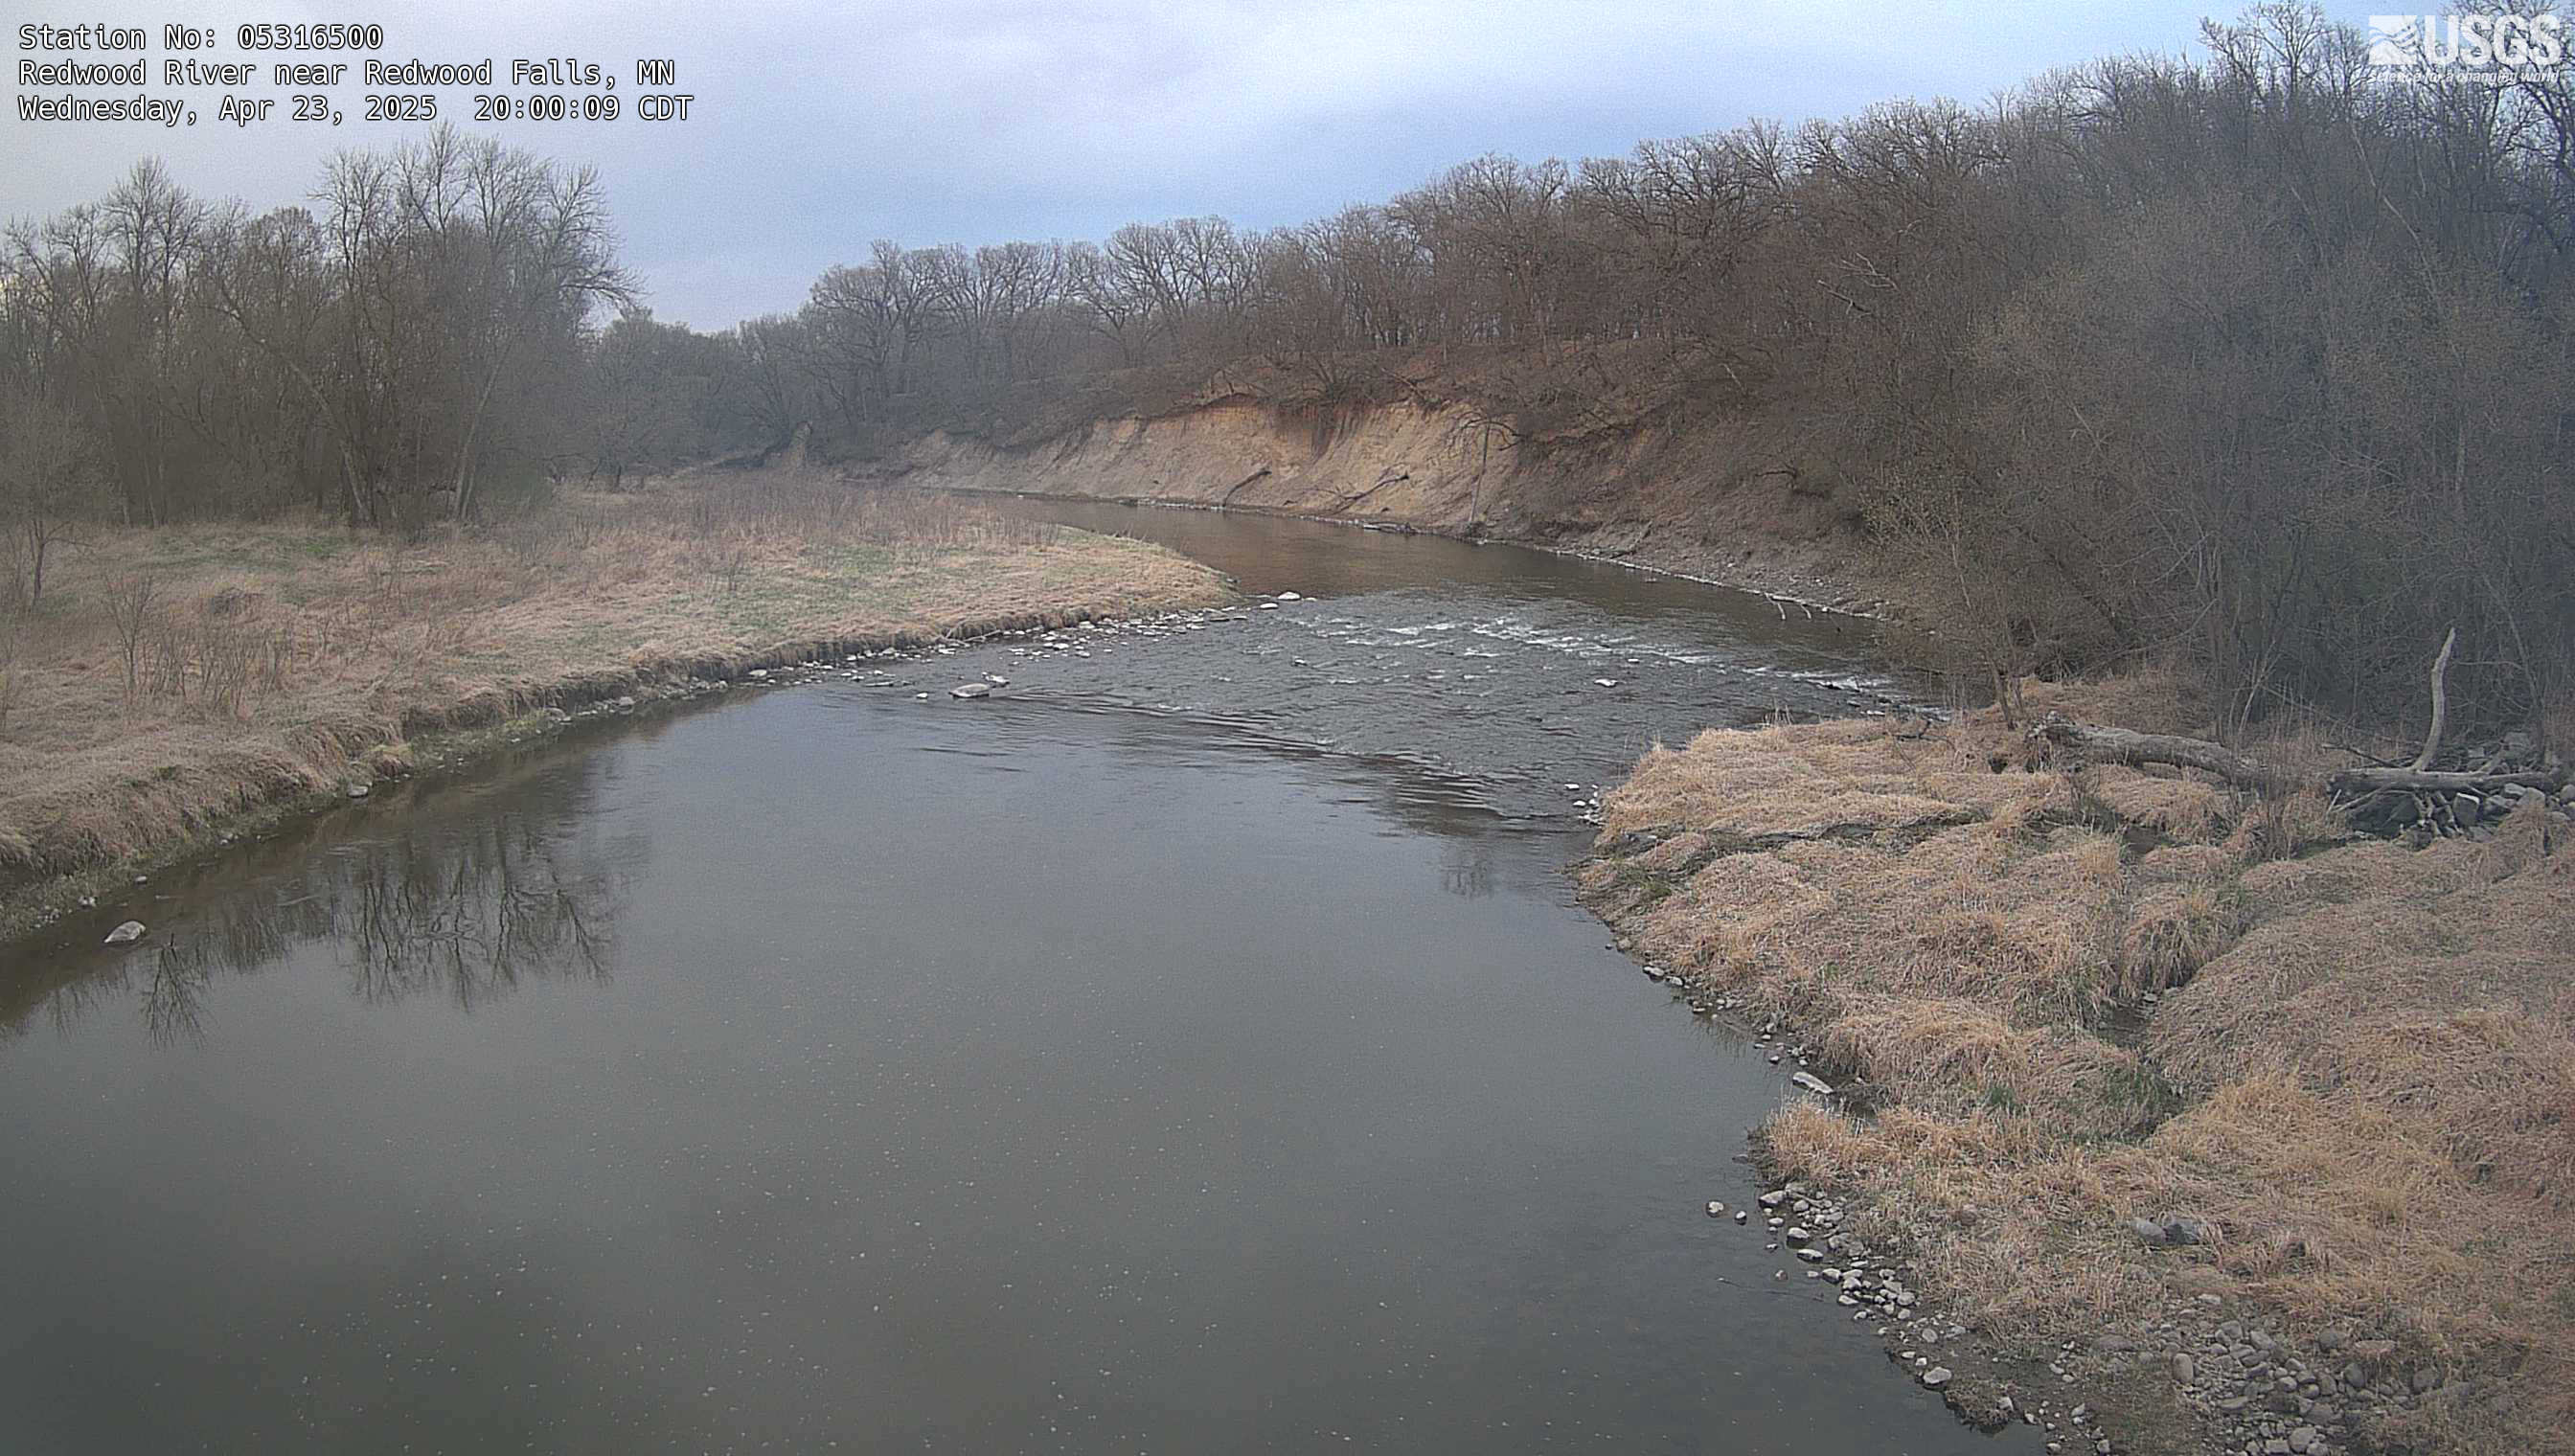
USGS WaterWatch's "Site Dashboard" provides seasonal and other context-oriented information about current and historical streamflow.

Recent Webcam Images:

Webcam images help USGS staff know when backwater from ice or other factors may affect discharge. Click on the image below to download or view larger versions from the USGS Hydrologic Imagery and Visualization Information System (HIVIS) web page.

Most recent photo<

Time-lapse videos are considered proof of concept with no guarantee of up time. Videos can be viewed using Chrome, Firefox or Opera browser applications on smartphone, tablet, and computer devices. Additional browser support for Safari and Internet Explorer may be added later.

Any use of trade, firm, or product names is for descriptive purposes only and does not imply endorsement by the U.S. Government.

This station managed by the Mounds View Field Office.

Available Parameters Available Period
  
1993-10-01  2024-03-28
2007-10-01  2024-03-28
2021-03-29  2024-03-28


 (7)
 

  -- or --


Summary of all available data for this site
Instantaneous-data availability statement


Discharge, cubic feet per second

Most recent instantaneous value: 66.4 03-28-2024   19:00 CDT
Graph of  Discharge, cubic feet per second

Add up to 2 more sites and replot for "Discharge, cubic feet per second"

?


Create presentation-quality / stand-alone graph.   Subscribe to WaterAlert      

See this graph on the Monitoring Location Pages


Daily discharge, cubic feet per second -- statistics for Mar 28 based on 92 water years of record more
Min
(1965)
Most Recent
Instantaneous
Value Mar 28
25th
percen-
tile
Median 75th
percen-
tile
Mean Max
(1997)
1.50 66.4 76 253 529 565 7090


Gage height, feet

Most recent instantaneous value: 2.05 03-28-2024   19:00 CDT
Graph of  Gage height, feet

Add up to 2 more sites and replot for "Gage height, feet"

?


Create presentation-quality / stand-alone graph.   Subscribe to WaterAlert      

See this graph on the Monitoring Location Pages


Stream water level elevation above NAVD 1988, in feet

Most recent instantaneous value: 974.98 03-28-2024   19:00 CDT
Graph of  Stream water level elevation above NAVD 1988, in feet

Add up to 2 more sites and replot for "Stream water level elevation above NAVD 1988, in feet"

?


Create presentation-quality / stand-alone graph.   Subscribe to WaterAlert      

See this graph on the Monitoring Location Pages