USGS 05341550 ST. CROIX RIVER AT STILLWATER, MN

PROVISIONAL DATA SUBJECT TO REVISION

Click to hidestation-specific text

USGS Logo Federal Priority Streamgage (formerly NSIP)

in cooperation with

U.S. Army Corps of Engineers - St. Paul Dist. Logo U.S. Army Corps of Engineers - St. Paul District

Metropolitan Council-Environmental Services Logo Metropolitan Council-Environmental Services

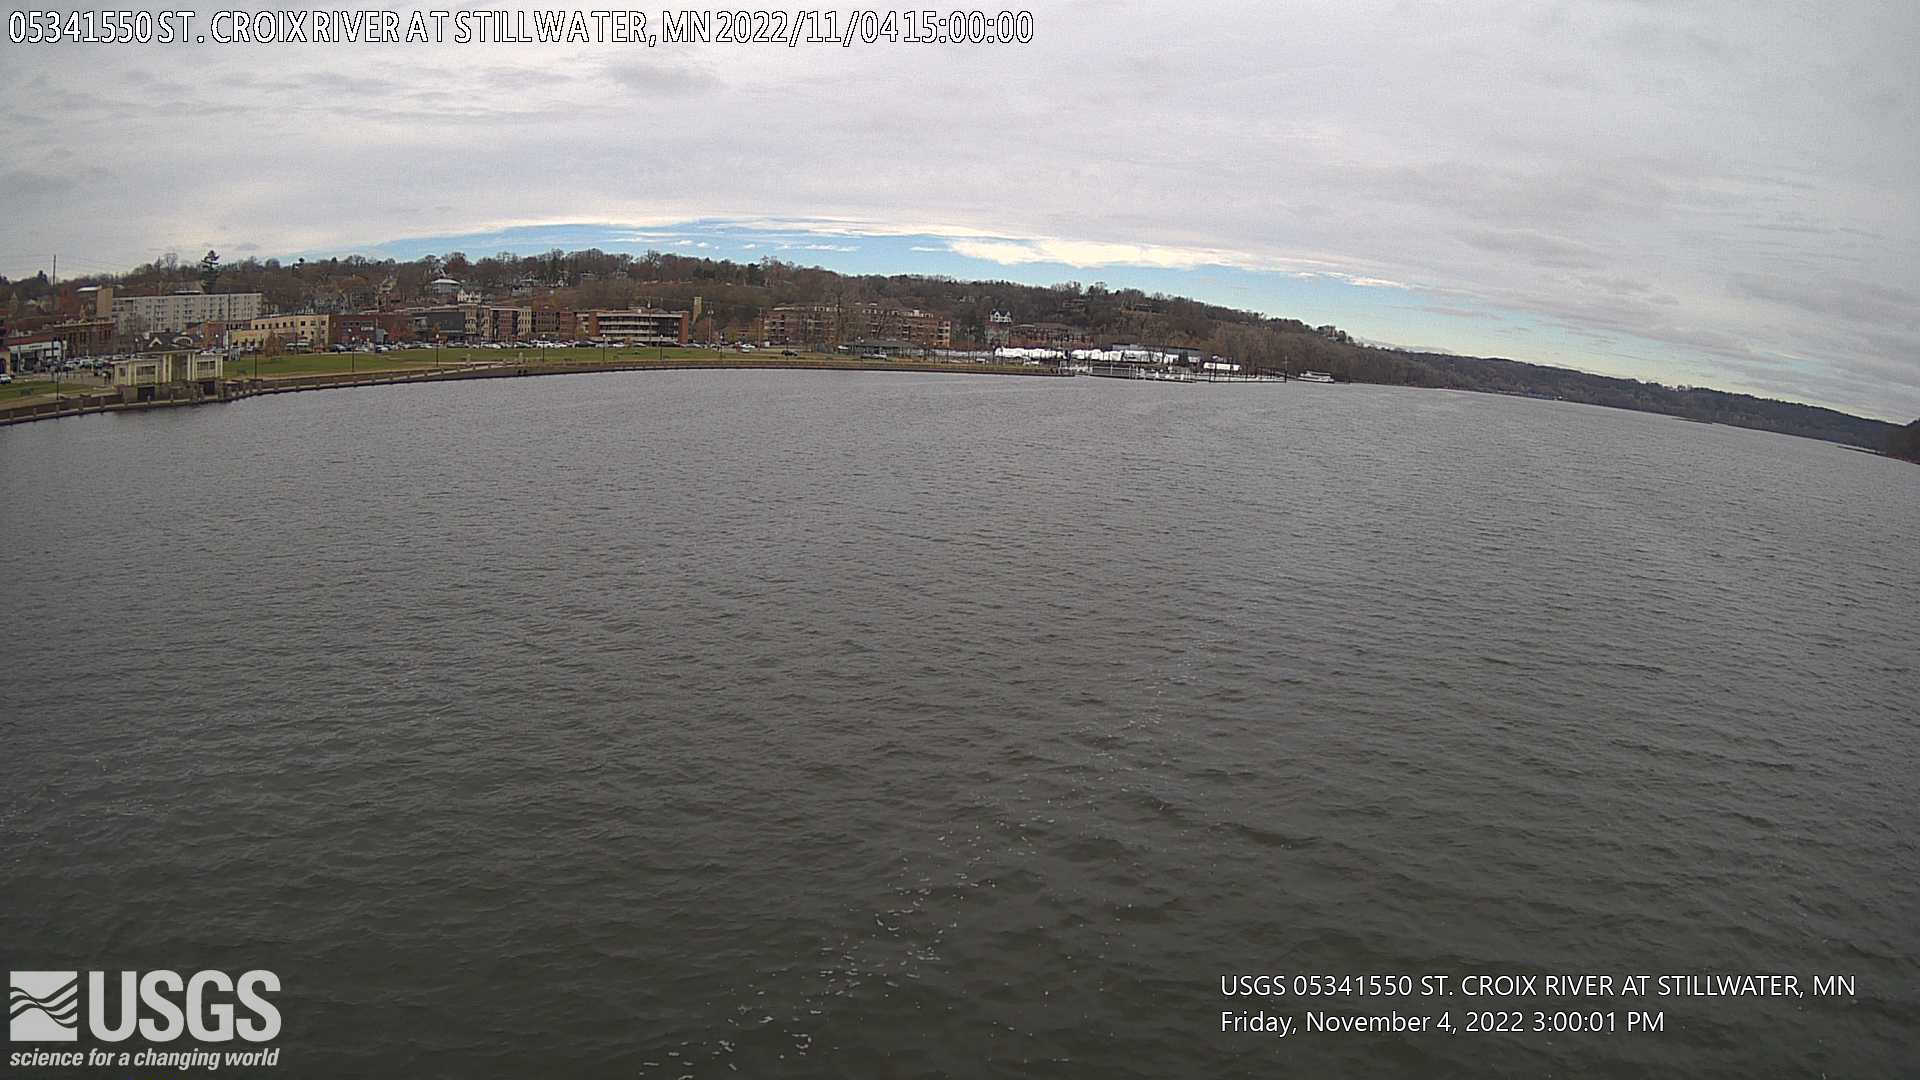
Recent Webcam Images:

Click on the static or time-lapse images below to download or view larger versions from the Storm Summary Time Lapse web page.

Most recent photo of creek

Time-lapse videos are considered proof of concept with no guarantee of up time. Videos can be viewed using Chrome, Firefox or Opera browser applications on smartphone, tablet, and computer devices. Additional browser support for Safari and Internet Explorer may be added later.

Any use of trade, firm, or product names is for descriptive purposes only and does not imply endorsement by the U.S. Government.

River forecasts are available when active at the:

National Weather Service Logo National Weather Service gage forecast page

USGS WaterWatch's "Site Dashboard" provides seasonal and other context-oriented information about current and historical streamflow.

Available Parameters Available Period
  
2023-12-18  2024-04-16
2011-09-10  2024-04-16
2011-05-01  2024-04-16
2021-04-16  2024-04-16
2023-12-18  2024-04-16


 (31)
 

  -- or --


Summary of all available data for this site
Instantaneous-data availability statement


Temperature, water, degrees Fahrenheit, [ADVM]

Most recent instantaneous value: 54.6 04-16-2024   07:00 CDT
Graph of  Temperature, water, degrees Fahrenheit, [ADVM]

Add up to 2 more sites and replot for "Temperature, water, degrees Fahrenheit, [ADVM]"

?


Create presentation-quality / stand-alone graph.   Subscribe to WaterAlert      

See this graph on the Monitoring Location Pages


Discharge, cubic feet per second

Most recent instantaneous value: 11000 04-16-2024   07:00 CDT
Graph of  Discharge, cubic feet per second

Add up to 2 more sites and replot for "Discharge, cubic feet per second"

?


Create presentation-quality / stand-alone graph.   Subscribe to WaterAlert      

See this graph on the Monitoring Location Pages


Gage height, feet

Most recent instantaneous value: 677.67 04-16-2024   07:00 CDT
Graph of  Gage height, feet

Add up to 2 more sites and replot for "Gage height, feet"

?


Create presentation-quality / stand-alone graph.   Subscribe to WaterAlert      

See this graph on the Monitoring Location Pages


Stream water level elevation above NAVD 1988, in feet

Most recent instantaneous value: 677.09 04-16-2024   07:00 CDT
Graph of  Stream water level elevation above NAVD 1988, in feet

Add up to 2 more sites and replot for "Stream water level elevation above NAVD 1988, in feet"

?


Create presentation-quality / stand-alone graph.   Subscribe to WaterAlert      

See this graph on the Monitoring Location Pages


Mean water velocity for discharge computation, feet per second

Most recent instantaneous value: 0.81 04-16-2024   07:00 CDT
Graph of  Mean water velocity for discharge computation, feet per second

Add up to 2 more sites and replot for "Mean water velocity for discharge computation, feet per second"

?


Create presentation-quality / stand-alone graph.   Subscribe to WaterAlert      

See this graph on the Monitoring Location Pages