LOCATION.--Lat 42°27'57", long
74°27'44" referenced to North American Datum of 1983,
Schoharie County, NY, Hydrologic Unit 02020005, on left bank
2,300 ft upstream from West Kill, and 1.2 mi upstream from
bridge on State Highway 30 in North Blenheim.
DRAINAGE AREA.--358 mi².
PERIOD OF RECORD.--Occasional discharge measurements,
water years 1969-70. October 1970 to current year (January 20
to September 30, 1996, discharges only for days of mean flow
less than or equal to 400 ft³/s).
REVISIONS HISTORY.--WDR NY-87-1: 1984(M). WDR NY-90-1:
Drainage area. WDR-US-2011: 2010(M). Gage
height and discharge for the period Apr. 11, 2019, to Oct. 1,
2019, were revised on Sept. 28, 2020, based on changes to the
gage primary reference.
GAGE.--Water-stage recorder and crest-stage gage. Datum
of gage is 793.92 ft above NAVD of 1988. Prior to Oct. 1, 1971,
at datum 1.00 ft higher.
COOPERATION.--Records of flow provided by the New York
Power Authority as explained in REMARKS.
REMARKS.--Regulation of flow by New York Power Authority
Blenheim-Gilboa Pumped Storage Project immediately upstream
from gage. Entire flow, runoff from 315 mi², except for periods
of spill, diverted from Schoharie Reservoir through Shandaken
Tunnel into Esopus Creek upstream from Ashokan Reservoir for
water supply of City of New York. For days of reservoir outflow
greater than 10 ft³/s, see station 01350101. From Jan. 19,
1996, through Sept. 30, 1998, if flow was greater than about
400 ft³/s, undetermined amounts of flow bypassed the gage. From
Oct. 1, 1998, through Sept. 30, 2000, if flow was greater than
about 2,000 ft³/s, undetermined amounts of flow bypassed the
gage. From Oct. 1, 2000, through Sept. 30, 2006, if flow was
greater than about 5,000 ft³/s, undetermined amounts of flow
bypassed the gage. From Oct. 1, 2006, through Aug. 27, 2011, if
flow was greater than about 6,000 ft³/s, undetermined amounts
of flow bypassed the gage. From Aug. 28, 2011, through Sept.
30, 2012, if flow was greater than about 30 ft³/s, undetermined
amounts of flow bypassed the gage. From Oct. 1, 2012, through
current year, if flow is greater than about 10,000 ft³/s,
undetermined amounts of flow bypass the gage. Since October
1996, records for periods when flows bypass the gage are
furnished by the New York Power Authority. Water Years 2014-23:
Records fair except those for estimated daily discharges, which
are poor.
EXTREMES FOR PERIOD OF RECORD.--Maximum discharge,
119,000 ft³/s, Aug. 28, 2011, from New York Power Authority,
gage height, 22.00 ft, outside gage height was 22.34 ft, from
floodmark; minimum, no flow, Oct. 12, 15, Oct. 16 to Nov. 1,
Nov. 2, 1972, Sept. 12, 13, 14, 1973.

 Site Information
 WaterAlert – get an
email or text (SMS) alert based on your chosen threshold.
WaterAlert – get an
email or text (SMS) alert based on your chosen threshold.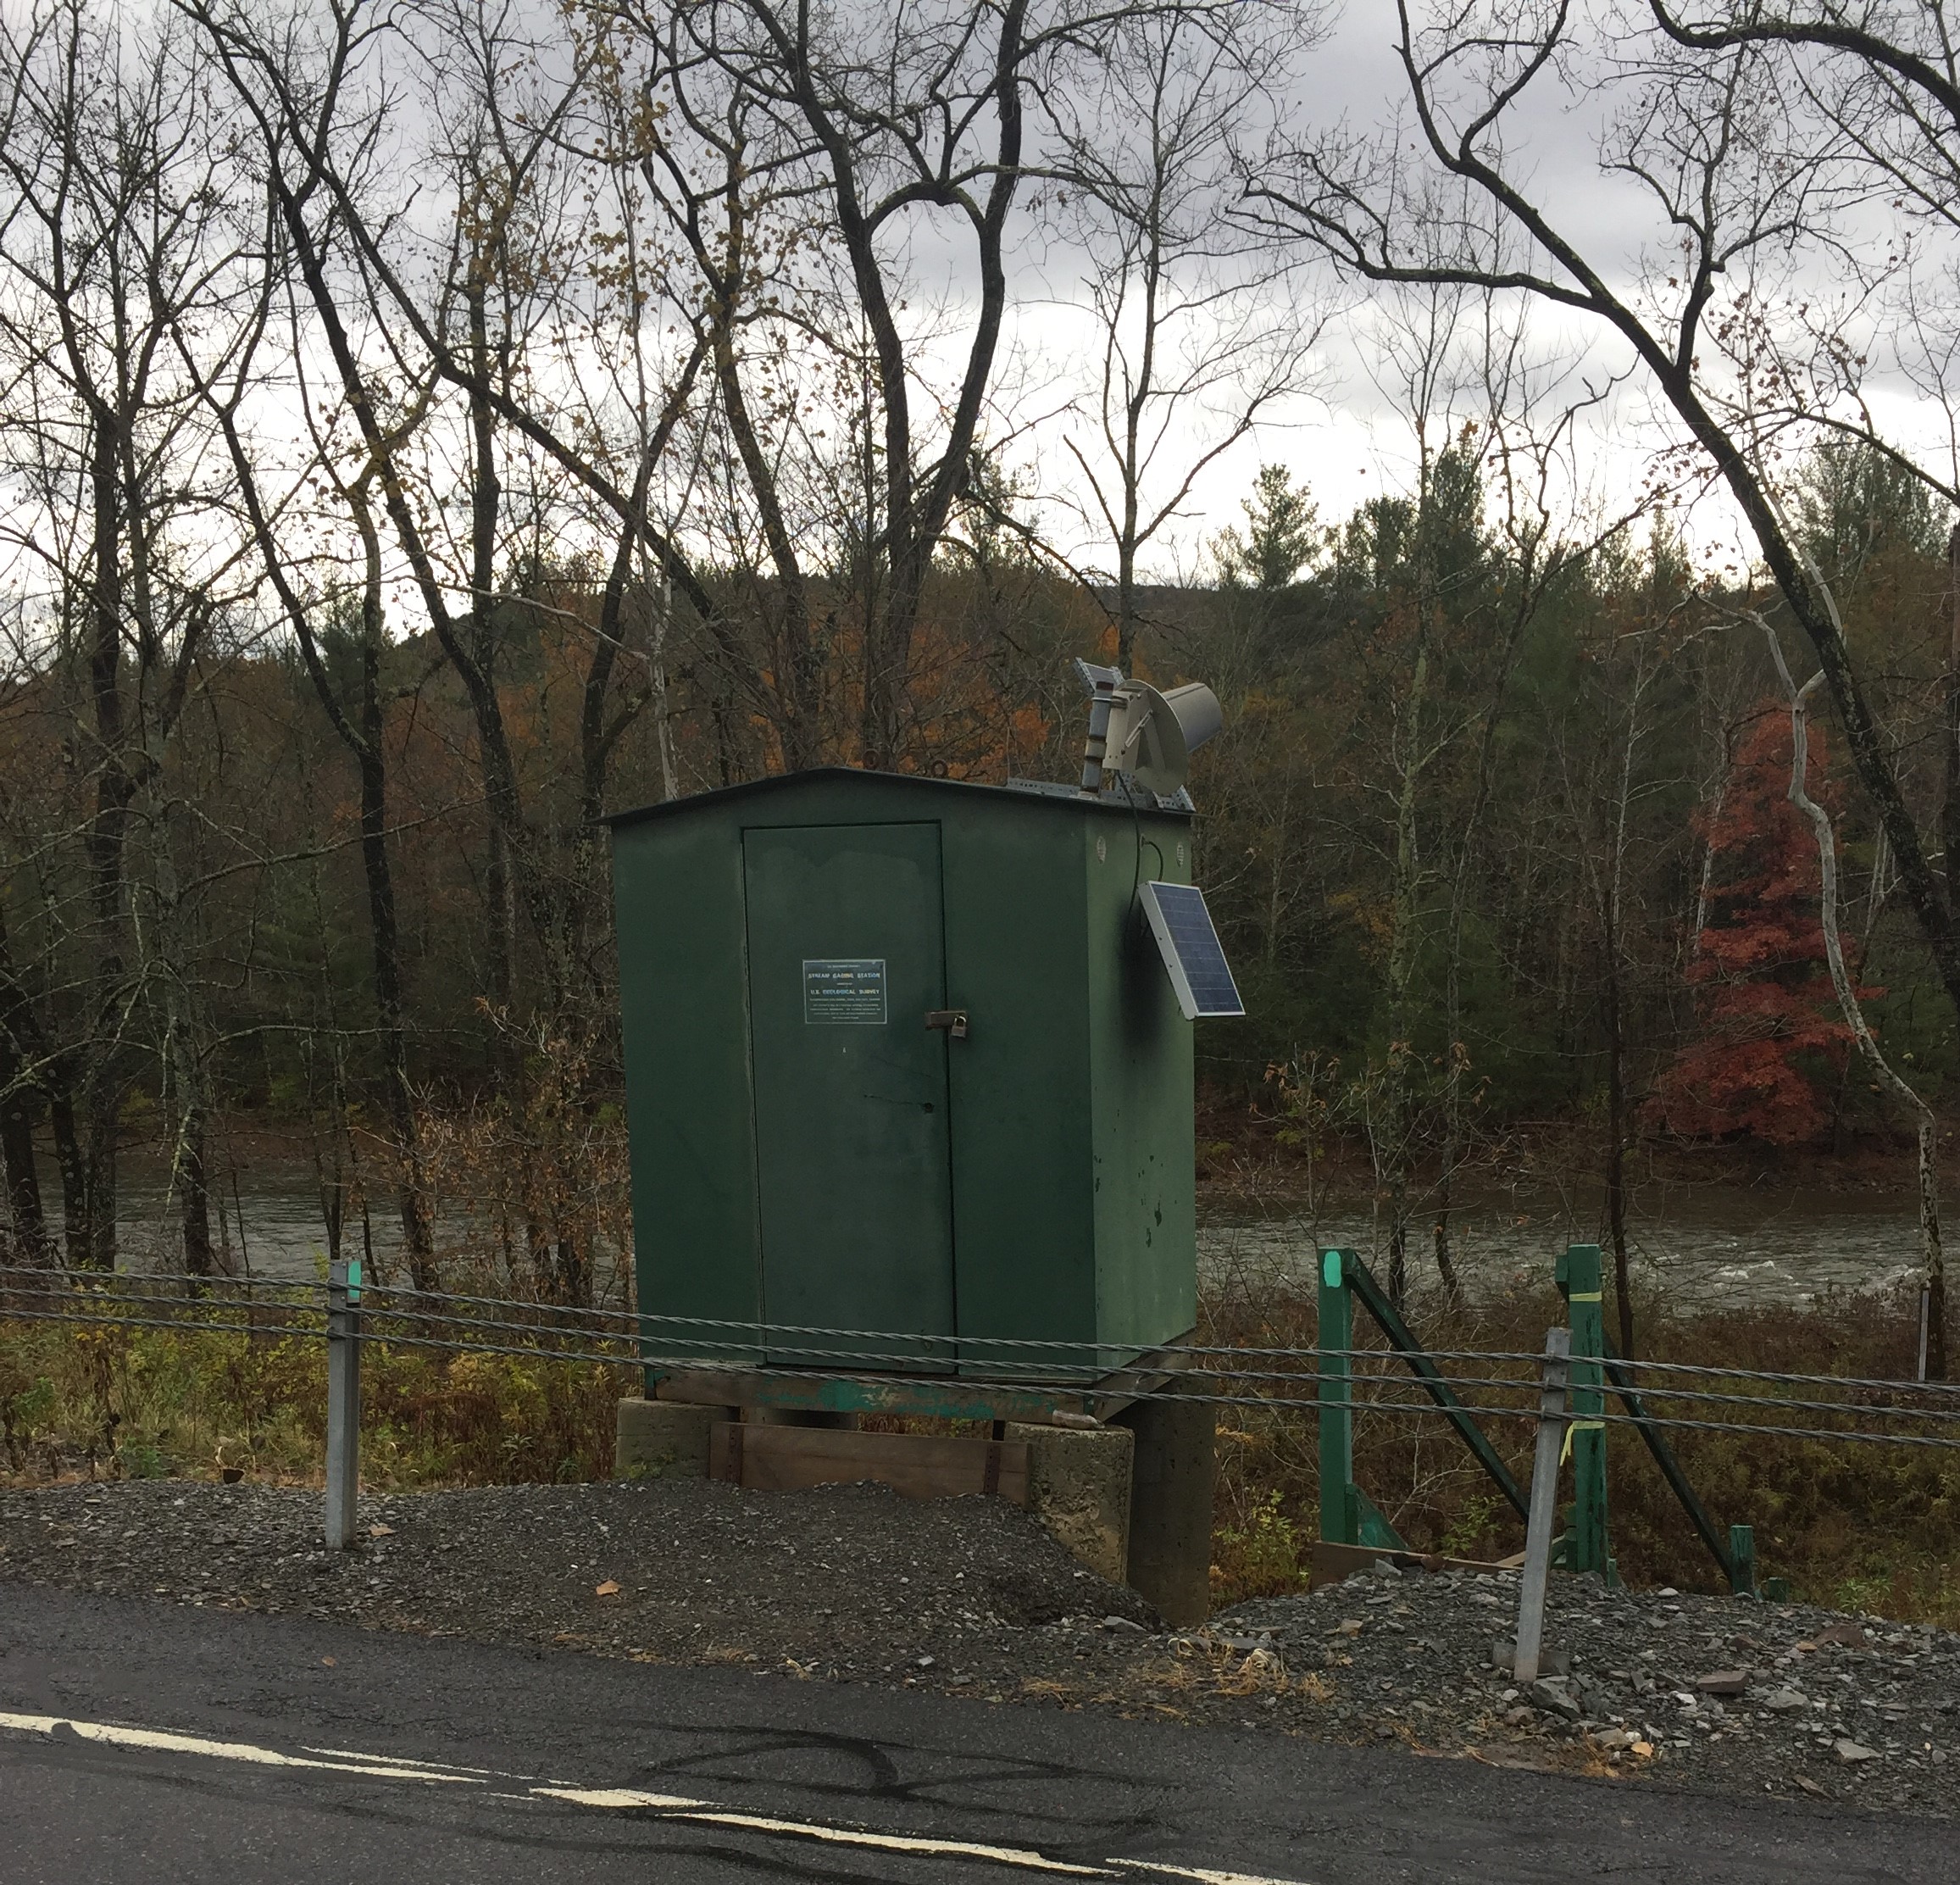 Station image