LOCATION.--Lat 42°32'15.5", long
74°24'36.9" referenced to North American Datum of
1983, Schoharie County, NY, Hydrologic Unit 02020005, on left
bank 100 ft downstream from bridge on State Highway 30, 0.9 mi
north of Breakabeen, and 1.1 mi downstream from Keyser
Kill.
DRAINAGE AREA.--444 mi².
PERIOD OF RECORD.--July 1975 to current year.
REVISIONS HISTORY.--WDR NY-81-1: 1980(M). WDR NY-90-1:
Drainage area. WDR-US-2011: 1996.
GAGE.--Water-stage recorder and crest-stage gage. Datum
of gage is 686.79 ft above NGVD of 1929 (Soil Conservation
Service benchmark) and 686.18 ft above NAVD of 1988.
REMARKS.--Considerable regulation of flow by
Blenheim-Gilboa Pumped Storage Project about 8 mi upstream.
Entire flow, runoff from 315 mi², except for periods of spill,
diverted from Schoharie Reservoir through Shandaken Tunnel into
Esopus Creek upstream from Ashokan Reservoir for water supply
of City of New York. For days of reservoir outflow greater than
10 ft³/s, see station 01350101.
Water Years 2014-22: Records fair except those for estimated
daily discharges, which are poor.
EXTREMES FOR PERIOD OF RECORD.--Maximum discharge,
134,000 ft³/s, Aug. 28, 2011, gage height, 22.37 ft, outside
gage height was 23.47 ft, from floodmarks, from rating curve
extended above 27,000 ft³/s on basis of contracted-opening and
flow-over-road measurement at gage height about 19.5 ft and
runoff comparisons of peak flow with nearby stations; minimum
discharge, 1.7 ft³/s, Oct. 14, 1980; minimum gage height, 0.25
ft, Sept. 26, 1985.

 Site Information
 WaterAlert – get an
email or text (SMS) alert based on your chosen threshold.
WaterAlert – get an
email or text (SMS) alert based on your chosen threshold.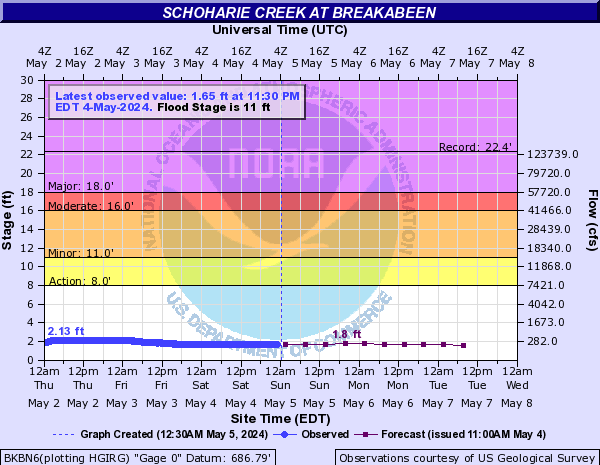
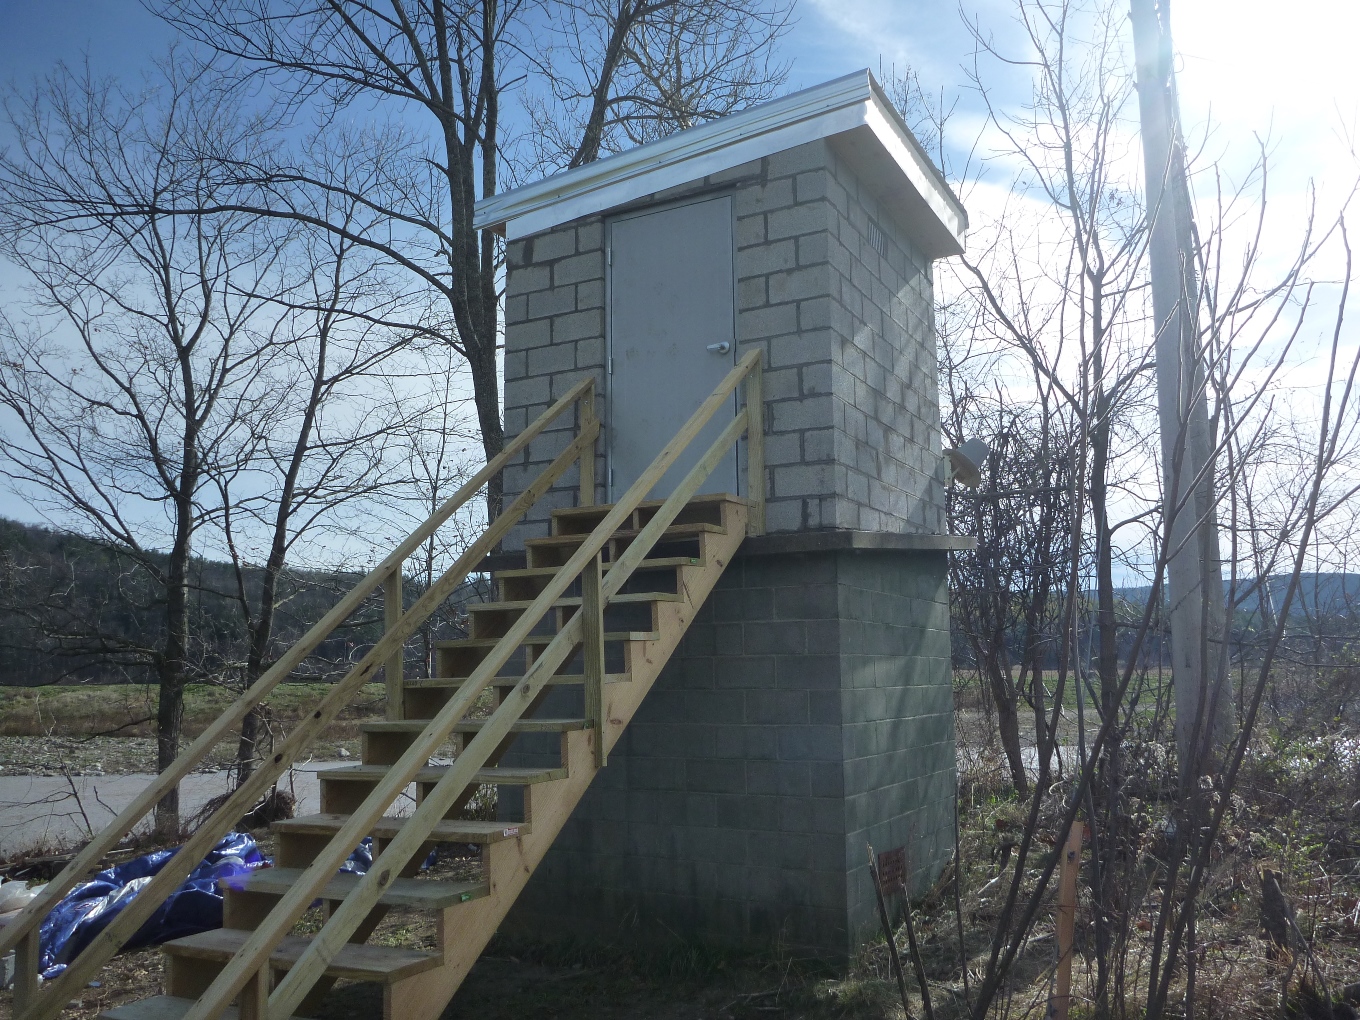 Station image