LOCATION.--Lat 41°58'01", long
74°26'53" referenced to North American Datum of 1983,
Ulster County, NY, Hydrologic Unit 02040104, on right bank 0.3
mi upstream from Tray Mill Brook, and 2.3 mi northeast of
Denning.
DRAINAGE AREA.--8.93 mi².
PERIOD OF RECORD.--Occasional discharge measurements,
water years 1988-90. October 1990 to March 2013, September 2019
to current year.
GAGE.--Water-stage recorder and crest-stage gage. Datum
of gage is 2,140.70 ft above NAVD of 1988.
REMARKS.--Water Years 2019-23: Records fair except those
for estimated daily discharges, which are poor.
EXTREMES FOR PERIOD OF RECORD.--Maximum discharge, 5,580
ft³/s, Aug. 28, 2011, gage height, 8.75 ft, from rating curve
extended above 750 ft³/s on basis of slope-area measurement at
gage height 6.96 ft; minimum discharge, 2.0 ft³/s, Aug. 7, 8,
9, 1991; minimum gage height, 0.38 ft, Aug. 26, Sept. 1, 2, 3,
2012.
PERIOD OF DAILY RECORD1.--SPECIFIC
CONDUCTANCE: September 2019 to current year. WATER
TEMPERATURE: September 2019 to current year.
INSTRUMENTATION1.--A continuous water-quality
monitor with water temperature and specific conductance
provides 15-minute-interval readings.
EXTREMES FOR PERIOD OF DAILY
RECORD1.--SPECIFIC CONDUCTANCE: Maximum, 23
uS/cm at 25 °C, Oct. 26, 2021; minimum, 5 uS/cm at 25 °C,
Oct. 31, Nov. 1, 2019, several days in September 2021, and Oct.
4, 5, 2021. WATER TEMPERATURE: Maximum, 17.9 °C, Aug.
8, 2022; minimum, -0.1 °C, on many days.
1 Water-Quality Records

 Site Information
 WaterAlert – get an
email or text (SMS) alert based on your chosen threshold.
WaterAlert – get an
email or text (SMS) alert based on your chosen threshold.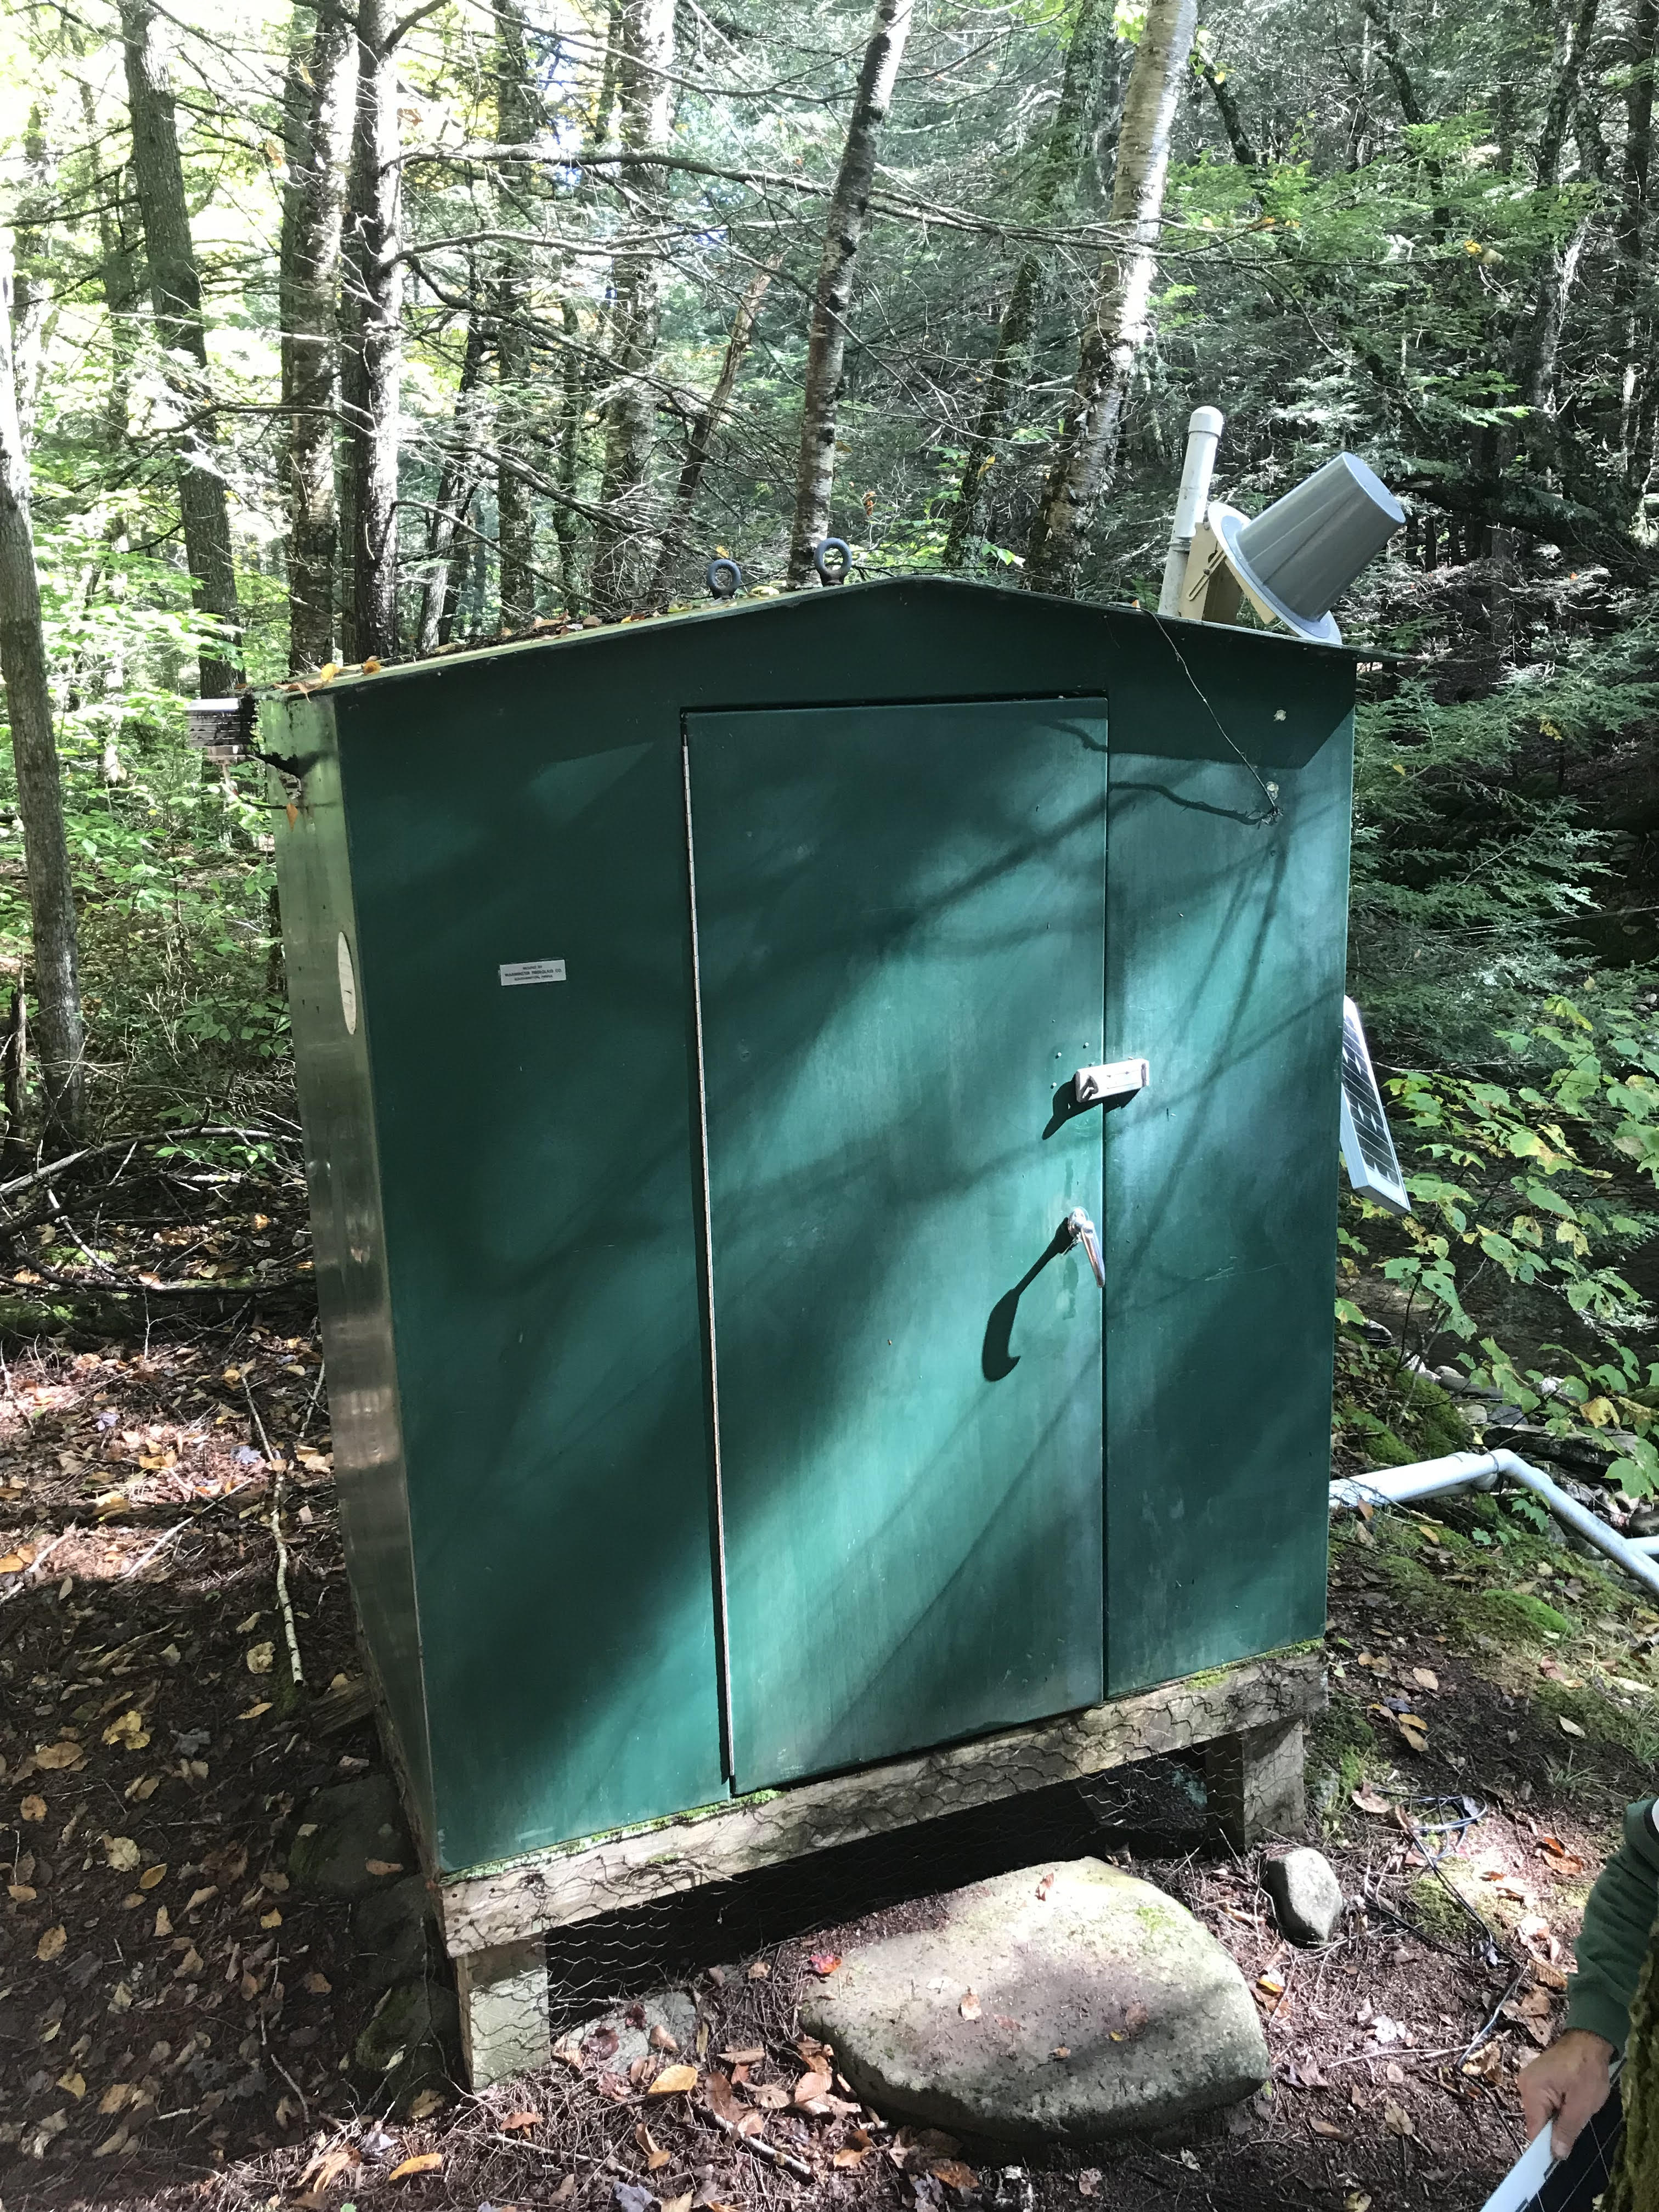 Station image

