Warning: Javascript must be enabled to use all the features on this page!


Page Loading - Please Wait...

Click to hideNews Bulletins

USGS 01483177 APPOQUINIMINK RIVER NEAR ODESSA, DE

PROVISIONAL DATA SUBJECT TO REVISION

Click to hidestation-specific text

Picture of gage

LOCATION.--Lat 39°27'57.4", long 75°36'48.7", New Castle County, Hydrologic Unit 02040205, on downstream 
   side of bridge on Silver Run Road (Rt. 9) near Odessa, about 3 mi upstream from the confluence with the Delaware River.  
DRAINAGE AREA.--Not determined.
PERIOD OF DAILY RECORD (WATER QUALITY).--November 2011 to current year.
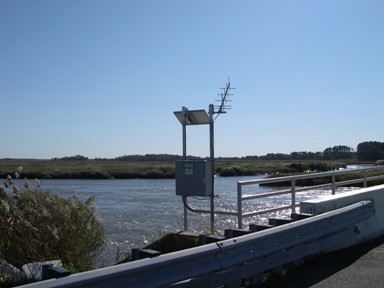
GAGE.--Electronic data logger and water-quality monitor.
REMARKS.--U.S. Geological Survey satellite data-collection platform at station.
COOPERATION.--Funding for this station is provided by the Delaware Department of Natural Resources
   and Environmental Control through the Delaware Geological Survey, and the U.S. Geological Survey.

This station managed by the MD-DE-DC Water Science Center Dover office.

Available Parameters Period of Record
  
2011-10-26  2024-04-23
2011-10-26  2024-04-23
2011-10-26  2024-04-23
2011-10-26  2024-04-23


 (365)
 

  -- or --


Summary of all available data for this site
Instantaneous-data availability statement


Temperature, water, degrees Celsius


Graph of DAILY Temperature, water, degrees Celsius

Add up to 2 more sites and replot for "Temperature, water, degrees Celsius"

?


Create presentation-quality graph.  


Specific conductance, water, unfiltered, microsiemens per centimeter at 25 degrees Celsius


Graph of DAILY Specific conductance, water, unfiltered, microsiemens per centimeter at 25 degrees Celsius

Add up to 2 more sites and replot for "Specific conductance, water, unfiltered, microsiemens per centimeter at 25 degrees Celsius"

?


Create presentation-quality graph.  


Dissolved oxygen, water, unfiltered, milligrams per liter


Graph of DAILY Dissolved oxygen, water, unfiltered, milligrams per liter

Add up to 2 more sites and replot for "Dissolved oxygen, water, unfiltered, milligrams per liter"

?


Create presentation-quality graph.  


pH, water, unfiltered, field, standard units


Graph of DAILY pH, water, unfiltered, field, standard units

Add up to 2 more sites and replot for "pH, water, unfiltered, field, standard units"

?


Create presentation-quality graph.