Warning: Javascript must be enabled to use all the features on this page!


Page Loading - Please Wait...

Click to hideNews Bulletins

USGS 01484525 MILLSBORO POND OUTLET AT MILLSBORO, DE

PROVISIONAL DATA SUBJECT TO REVISION

Click to hidestation-specific text

LOCATION.--Lat 38°35'40.4", long 75°17'27.7", Sussex County, DE, Hydrologic Unit 02040303, on right 
   bank on upstream side of bridge on State Highway 24, upstream from Millsboro Pond Dam, at
   Millsboro.
DRAINAGE AREA.--61.7 mi2.
REVISIONS HISTORY (WQ).--https://waterdata.usgs.gov/nwis/dv/?site_no=01484525: 2013.
PERIOD OF RECORD.--May 1986 to September 1988. March 1991 to current year.
GAGE.--Water-stage recorder, concrete control, and crest-stage gage. Datum of gage is 1.19 ft above 
   North American Vertical Datum of 1988.
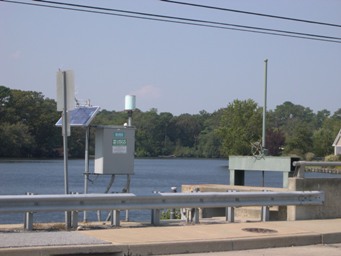
REMARKS.--Outflow from lake controlled by sluice gates at outlet. Natural flow of stream affected
   by inflow from sand mine de-watering process. U.S. Geological Survey satellite data-collection
   platform at station.
EXTREMES FOR PERIOD OF RECORD.--Maximum discharge, 2,080 ft3/s, Sept. 30, 2016, gage height, 4.95 ft;
   minimum discharge, 0.0 ft3/s, no flow, Aug. 29-31, 1998, July 9, 2012.
COOPERATION.--Funding for this station is provided by the Delaware Department of Natural Resources
   and Environmental Control through the Delaware Geological Survey, and the U.S. Geological Survey.
This station managed by the MD-DE-DC Water Science Center Dover office.

Available Parameters Period of Record
  
2006-10-01  2024-04-23
1986-05-01  2024-04-23
2006-10-01  2024-04-23
2006-10-01  2024-04-23
2006-10-01  2024-04-23


 (365)
 

  -- or --


Summary of all available data for this site
Instantaneous-data availability statement


Temperature, water, degrees Celsius


Graph of DAILY Temperature, water, degrees Celsius

Add up to 2 more sites and replot for "Temperature, water, degrees Celsius"

?


Create presentation-quality graph.  


Discharge, cubic feet per second


Graph of DAILY Discharge, cubic feet per second

Add up to 2 more sites and replot for "Discharge, cubic feet per second"

?


Create presentation-quality graph.  


Specific conductance, water, unfiltered, microsiemens per centimeter at 25 degrees Celsius


Graph of DAILY Specific conductance, water, unfiltered, microsiemens per centimeter at 25 degrees Celsius

Add up to 2 more sites and replot for "Specific conductance, water, unfiltered, microsiemens per centimeter at 25 degrees Celsius"

?


Create presentation-quality graph.  


Dissolved oxygen, water, unfiltered, milligrams per liter


Graph of DAILY Dissolved oxygen, water, unfiltered, milligrams per liter

Add up to 2 more sites and replot for "Dissolved oxygen, water, unfiltered, milligrams per liter"

?


Create presentation-quality graph.  


pH, water, unfiltered, field, standard units


Graph of DAILY pH, water, unfiltered, field, standard units

Add up to 2 more sites and replot for "pH, water, unfiltered, field, standard units"

?


Create presentation-quality graph.