LOCATION.--Lat 42°36'09.6", long
76°09'33.8" referenced to North American Datum of
1983, Cortland County, NY, Hydrologic Unit 02050102, on right
bank at east end of Elm Street at Cortland, 0.4 mi downstream
from confluence of East and West Branches.
DRAINAGE AREA.--292 mi². including 14.0 mi², the flow
from which may be diverted into DeRuyter Reservoir in Oswego
River basin.
PERIOD OF RECORD.--May 1938 to current year.
REVISIONS HISTORY.--WSP 2103: Drainage area. WDR
NY-74-1: 1973.
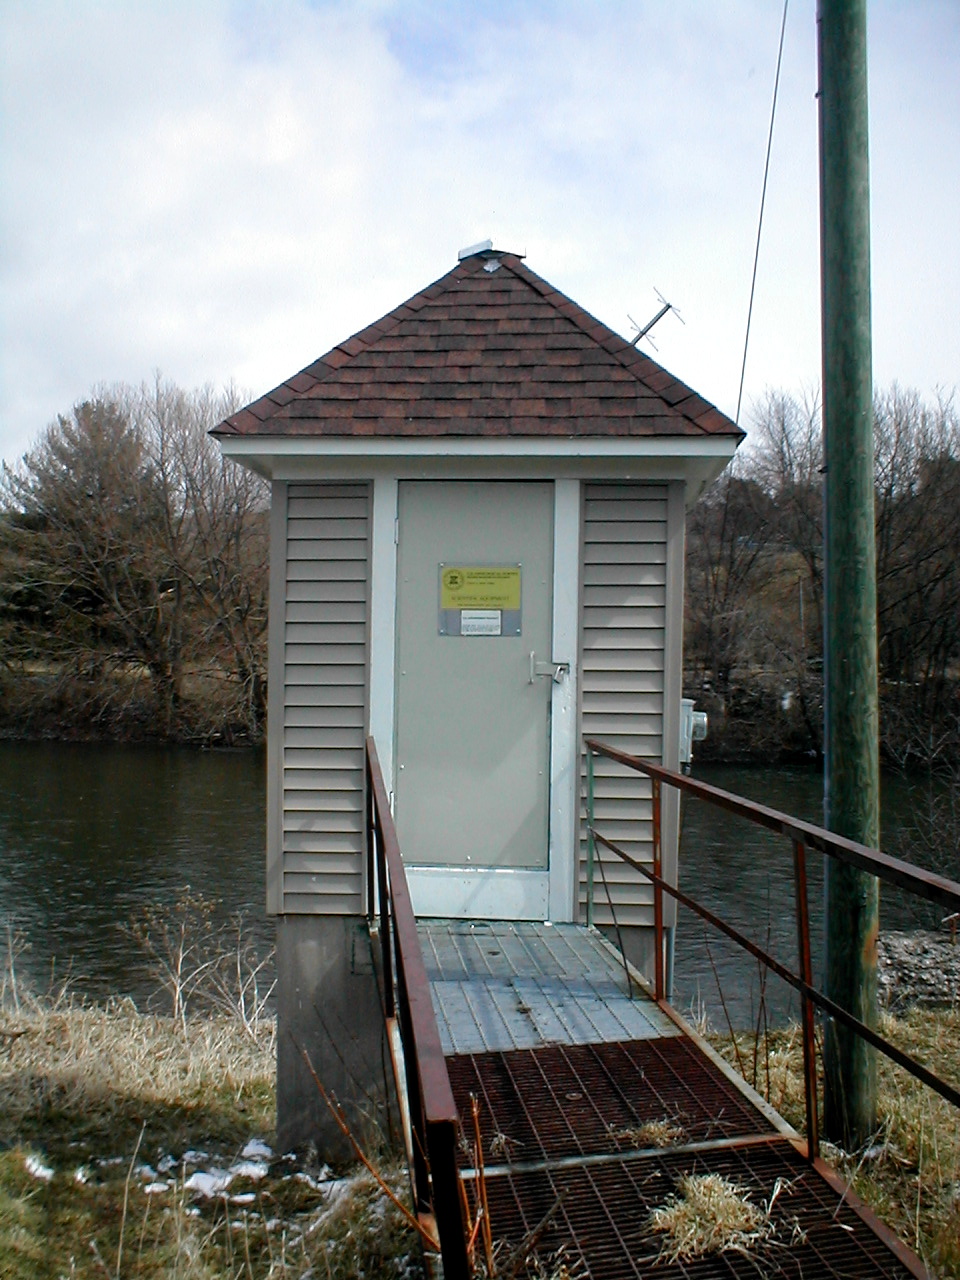
GAGE.--Water-stage recorder. Datum of gage is 1,084.92
ft above NGVD of 1929 and 1,084.46 ft above NAVD of 1988. Prior
to Oct. 1, 1939, at datum 4.00 ft higher. Oct. 1, 1939 to Sept.
30, 1963, at datum 3.00 ft higher.
REMARKS.--Diurnal fluctuation at low and medium flow
caused by operation of mills on West Branch. Slight diversion
from East Branch for operation of Erie (Barge) Canal. Slight
diversion from Gate House Pond on West Branch 17 mi upstream
from station into Onondaga Creek basin (St. Lawrence River
basin).
Water Years 2014-17: Records good except those for estimated
daily discharges, which are fair. Water Years 2018-23: Records
good except those for estimated daily discharges, which are
poor.
EXTREMES FOR PERIOD OF RECORD.--Maximum discharge,
14,200 ft³/s, Apr. 3, 2005, gage height, 14.07 ft; minimum
discharge, 9.8 ft³/s, Sept. 20, 1939, Sept. 29, 1959.

 Site Information
 WaterAlert – get an
email or text (SMS) alert based on your chosen threshold.
WaterAlert – get an
email or text (SMS) alert based on your chosen threshold.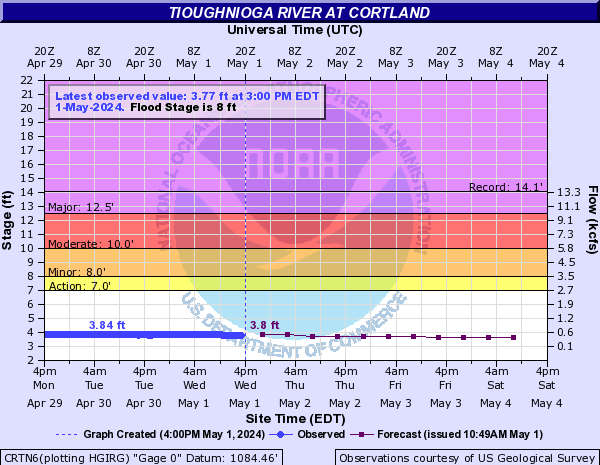
 Station image