LOCATION.--Lat 42°32'28", long
75°53'59" referenced to North American Datum of 1983,
Cortland County, NY, Hydrologic Unit 02050102, on right bank
150 ft upstream from Mead Brook, and 300 ft downstream from
bridge on County Highway 159 at Cincinnatus.
DRAINAGE AREA.--147 mi².
PERIOD OF RECORD.--June 1938 to September 1964, October
1969 to current year.
REVISIONS HISTORY.--WSP 2103: Drainage area.
WDR-US-2010: 2005-09. WDR-US-2012: 2011.
GAGE.--Water-stage recorder. Datum of gage is 1,031.67
ft above NGVD of 1929 and 1,031.11 ft above NAVD of 1988.
REMARKS.--Water Years 2014-23: Records fair except those
for estimated daily discharges, which are poor.
EXTREMES FOR PERIOD OF RECORD.--Maximum discharge, 8,390
ft³/s, Dec. 30, 1942, gage height, 10.67 ft; maximum gage
height, 10.89 ft, Jan. 19, 1996 (ice jam); minimum discharge,
3.8 ft³/s, Sept. 25, 1939.

 Site Information
 WaterAlert – get an
email or text (SMS) alert based on your chosen threshold.
WaterAlert – get an
email or text (SMS) alert based on your chosen threshold.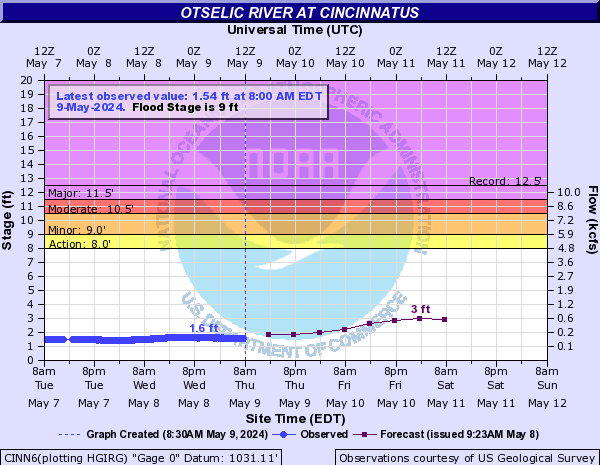
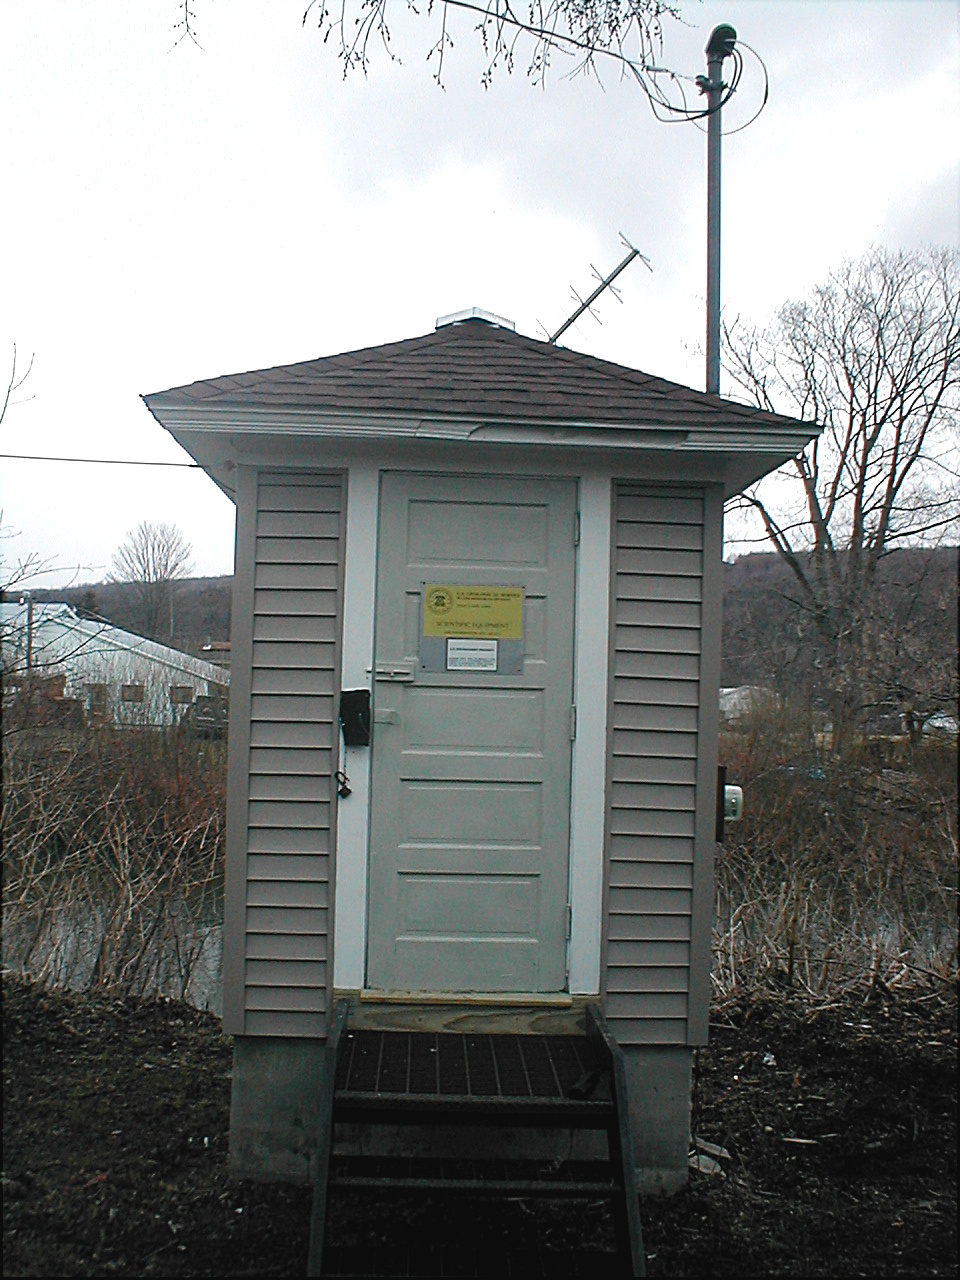 Station image