LOCATION.--Lat 43°18'03.6", long
78°18'37.6" referenced to North American Datum of
1983, Orleans County, NY, Hydrologic Unit 04130001, on right
bank, at downstream side of bridge on Townline Road, 1.6 mi
southwest of Kenyonville, and 9.6 mi upstream of mouth.
DRAINAGE AREA.--202 mi².
PERIOD OF RECORD.--August 2012 to current year.
GAGE.--Water-stage recorder and crest-stage
gage. Datum of gage is 327.43 ft above NAVD of 1988.
REMARKS.--Discharge includes undetermined diversion from
Erie (Barge) Canal, 6 mi upstream from station. Flow regulated
to some extent by Glenwood Lake hydroelectric reservoir 9.6 mi
upstream from station.
Water Years 2014-17: Records good except those for estimated
daily discharges, which are fair. Water Years 2018-19: Records
good except those for estimated daily discharges, which are
poor. Water Years 2020-23: Records fair except those for
estimated daily discharges, which are poor.
EXTREMES FOR PERIOD OF RECORD.--Maximum discharge, 3,590
ft³/s, May 2, 2017, gage height, 5.40 ft; maximum gage
height, 8.82 ft, Dec. 22, 2013 (ice jam); minimum
discharge, about 5 ft³/s, Aug. 24, 2018, due to
regulation.

 Site Information
 WaterAlert – get an
email or text (SMS) alert based on your chosen threshold.
WaterAlert – get an
email or text (SMS) alert based on your chosen threshold.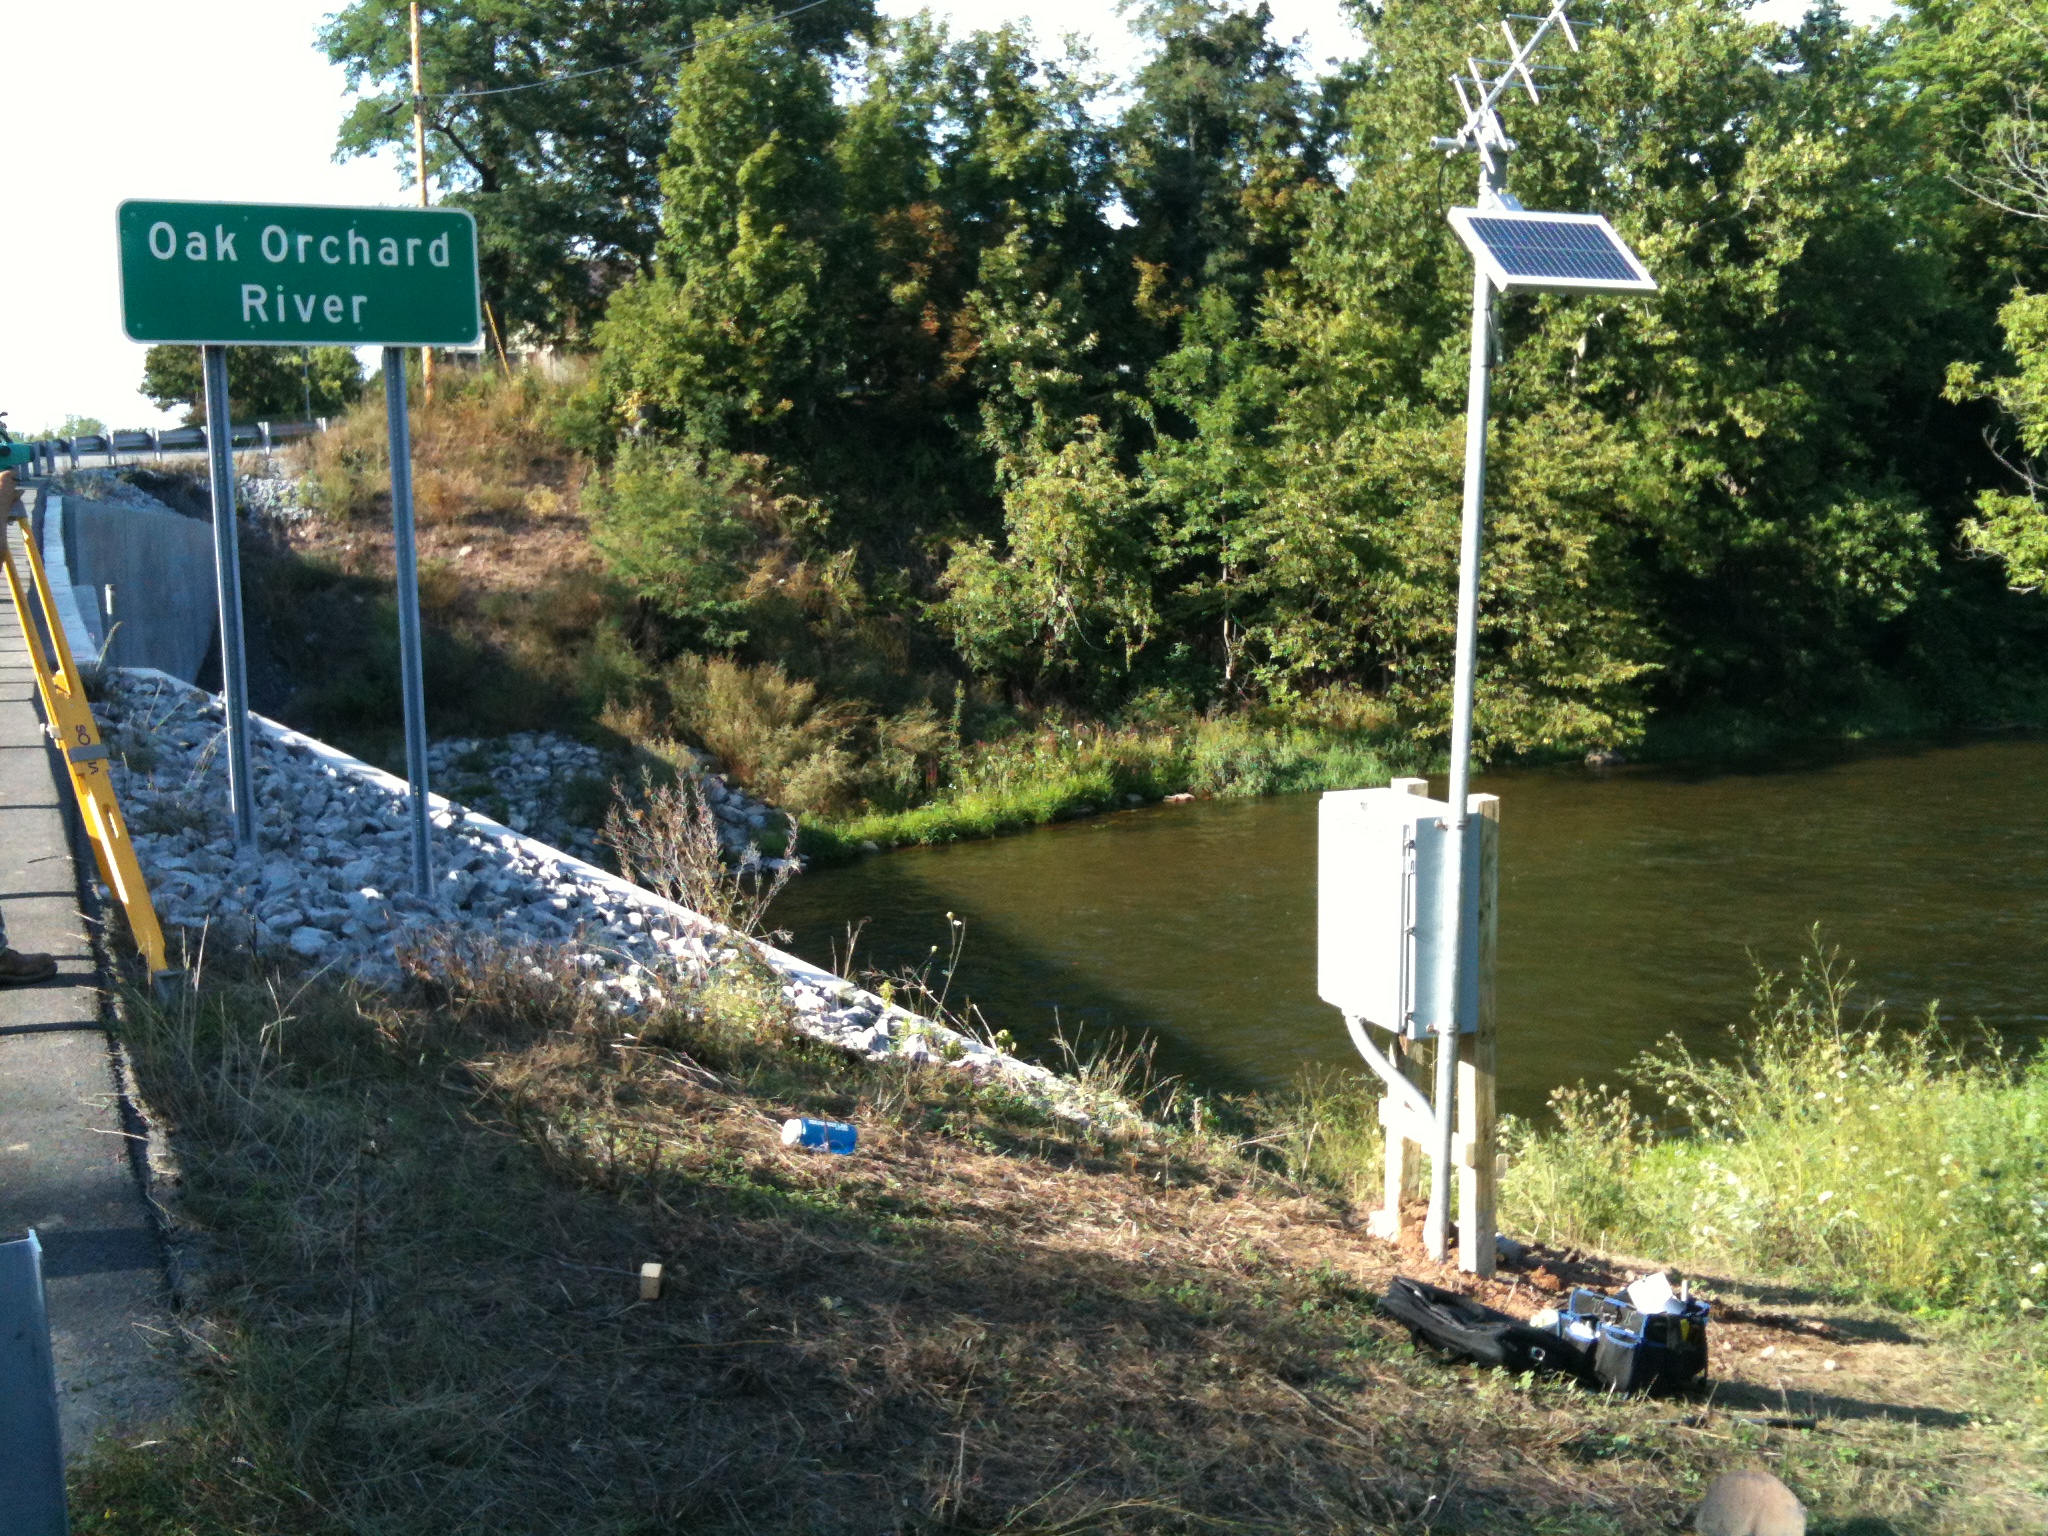 Station image

