LOCATION.--Lat 42°07'20", long
77°57'26" referenced to North American Datum of 1983,
Allegany County, NY, Hydrologic Unit 04130002, on left bank 35
ft upstream from concrete weir at Wellsville, 0.5 mi upstream
from bridge on State Highway 17, 0.6 mi upstream from Crowner
Brook and sewage treatment plant, 0.6 mi downstream from Dyke
Creek, and 140.9 mi upstream from mouth.
DRAINAGE AREA.--288 mi².
PERIOD OF RECORD.--August 1955 to September 1958,
October 1972 to current year. Records for June 1916 to
September 1972, published as Genesee River at Scio (station
04221500) at site 5.2 mi downstream, are not equivalent because
of difference in drainage areas.
REVISIONS HISTORY.--WDR NY-82-3: Drainage area.
GAGE.--Water-stage recorder and concrete control. Datum
of gage is 1,470.00 ft above NGVD of 1929 and 1469.51 ft above
NAVD of 1988. August 1955 to September 1957, at same site at
datum 8.00 ft higher. October 1957 to September 1958,
nonrecording gage at site 0.4 mi upstream at datum 3.00 ft
higher.
REMARKS.--Water Years 2014-23: Records good except those
for estimated daily discharges, which are poor.
EXTREMES FOR PERIOD OF RECORD.--Maximum discharge,
22,700 ft³/s, Jan. 19, 1996, gage height, 16.13 ft; minimum
discharge, 11 ft³/s, Sept. 2, 3, 1991, Aug. 19, Sept. 6,
1999.
EXTREMES OUTSIDE PERIOD OF RECORD.--Maximum discharge
since June 1916, 38,500 ft³/s, June 23, 1972, gage height, 20.7
ft, present datum, from floodmark, on basis of
contracted-opening measurement of peak flow 0.5 mi
downstream.
PERIOD OF RECORD1.--SUSPENDED-SEDIMENT
DISCHARGE: April 1975 to September 1977.
EXTREMES FOR PERIOD OF DAILY
RECORD1.--SUSPENDED-SEDIMENT CONCENTRATION:
Maximum daily mean, 1,280 mg/L, June 5, 1975; minimum daily
mean, 0 mg/L, Apr. 2, 1975. SUSPENDED-SEDIMENT DISCHARGE:
Maximum daily, 15,200 tons, Feb. 17, 1976; minimum daily, 0
ton, Apr. 2, 1975.
1 Water-Quality Records

 Site Information
 WaterAlert – get an
email or text (SMS) alert based on your chosen threshold.
WaterAlert – get an
email or text (SMS) alert based on your chosen threshold.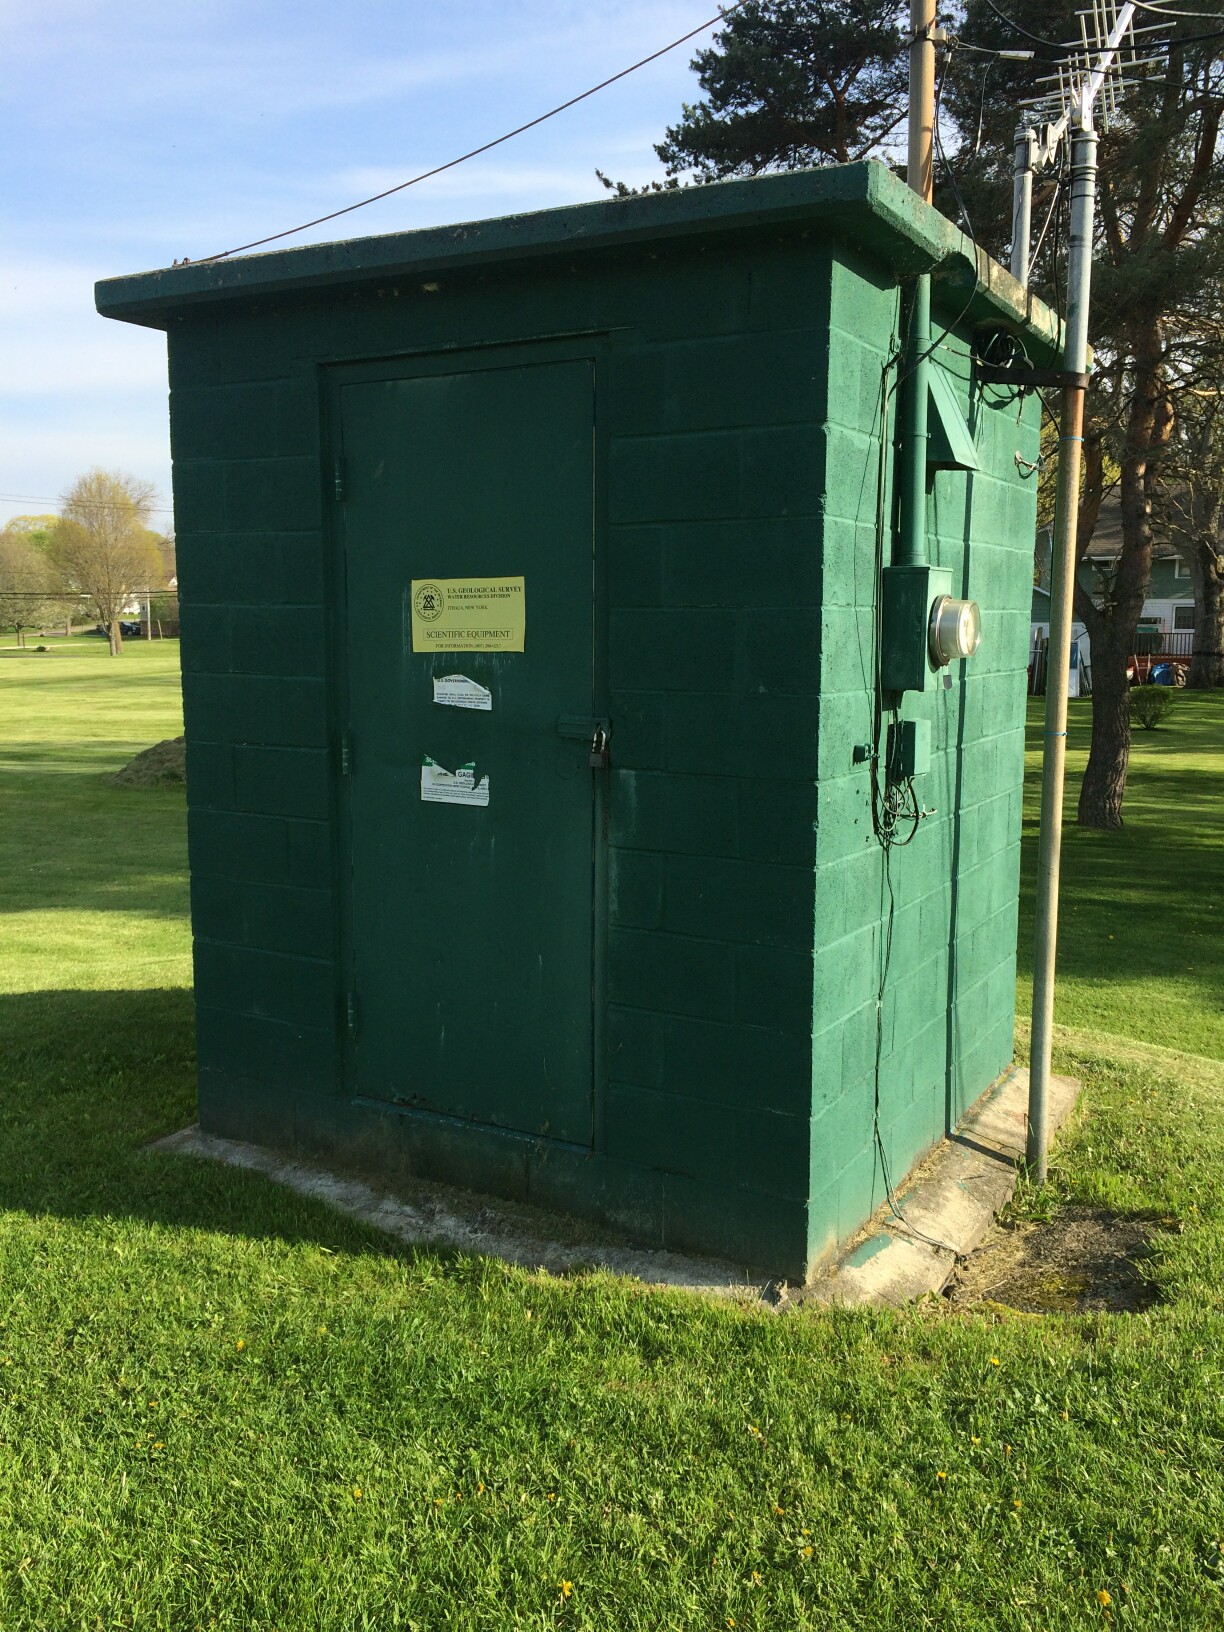 Station image