LOCATION.--Lat 42°04'09", long 91°47'06"
referenced to North American Datum of 1927, in SE 1/4 SE 1/4 SW 1/4
sec.21, T.84 N., R.8 W., Linn County, IA, Hydrologic Unit 07080205,
on right bank 5 ft downstream from bridge on Blairs Ferry Road in
Palo, 0.6 mi downstream from Bear Creek, 800 ft upstream from Dry
Creek, and 100 mi upstream from mouth. (map)
DRAINAGE AREA.--6,342 mi2.
SURFACE-WATER RECORDS
PERIOD OF RECORD.--Discharge records from March 2009 to current
year.
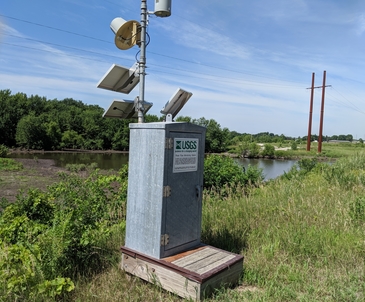
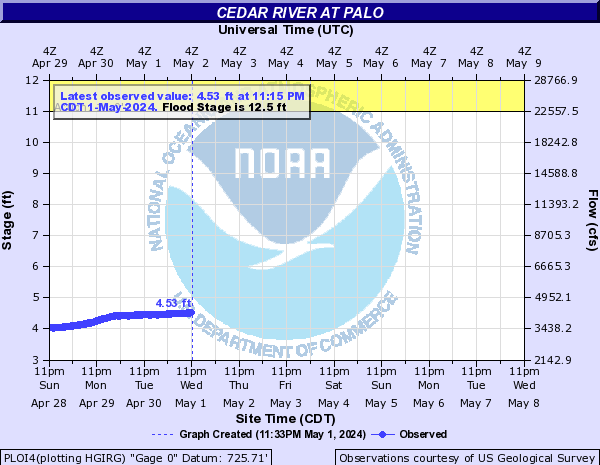
GAGE.--Water-stage recorder. Datum of gage is 725.71 ft above
National Geodetic Vertical Datum of 1929.
WATER-QUALITY RECORDS
PERIOD OF RECORD.--Water years 1992, 2001-2002, 2004, 2011-2012.
Period of record includes water-quality data published in USGS annual
reports and various project reports.

 Site Information