Warning: Javascript must be enabled to use all the features on this page!


Page Loading - Please Wait...

Click to hideNews Bulletins

USGS 06805500 Platte River at Louisville, Nebr

PROVISIONAL DATA SUBJECT TO REVISION

Click to hidestation-specific text
> WaterNow – get the latest gage data from your mobile phone or email.

> Rating Information

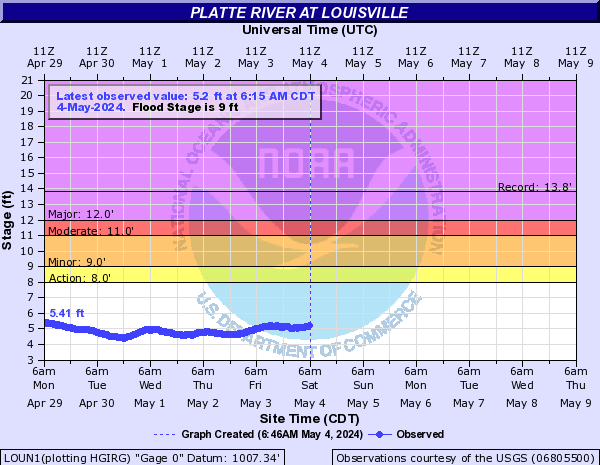
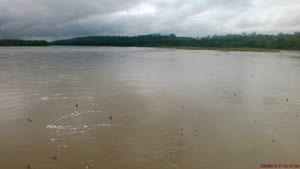
Downstream view near USGS gaging station: Platte River at Louisville, Nebr.

Upstream Platte River Basin
(Salt Creek-mouth)
Downstream

This station managed by the Lincoln Field Office.

Available Parameters Period of Record
  
2007-05-16  2024-04-22
2002-10-01  2007-07-16
1953-06-01  2024-04-22
1985-11-09  2024-04-22
2007-05-18  2024-04-22
2007-05-16  2024-04-22
2007-05-16  2007-09-29
2012-06-05  2024-04-22
2007-05-15  2024-04-22


 (365)
 

  -- or --


Summary of all available data for this site
Instantaneous-data availability statement


Temperature, water, degrees Celsius


Graph of DAILY Temperature, water, degrees Celsius

Add up to 2 more sites and replot for "Temperature, water, degrees Celsius"

?


Create presentation-quality graph.  


Discharge, cubic feet per second


Graph of DAILY Discharge, cubic feet per second

Add up to 2 more sites and replot for "Discharge, cubic feet per second"

?


Create presentation-quality graph.  


Gage height, feet


Graph of DAILY Gage height, feet

Add up to 2 more sites and replot for "Gage height, feet"

?


Create presentation-quality graph.  


Specific conductance, water, unfiltered, microsiemens per centimeter at 25 degrees Celsius


Graph of DAILY Specific conductance, water, unfiltered, microsiemens per centimeter at 25 degrees Celsius

Add up to 2 more sites and replot for "Specific conductance, water, unfiltered, microsiemens per centimeter at 25 degrees Celsius"

?


Create presentation-quality graph.  


Dissolved oxygen, water, unfiltered, milligrams per liter


Graph of DAILY Dissolved oxygen, water, unfiltered, milligrams per liter

Add up to 2 more sites and replot for "Dissolved oxygen, water, unfiltered, milligrams per liter"

?


Create presentation-quality graph.  


Nitrate plus nitrite, water, unfiltered, milligrams per liter as nitrogen


Graph of DAILY Nitrate plus nitrite, water, unfiltered, milligrams per liter as nitrogen

Add up to 2 more sites and replot for "Nitrate plus nitrite, water, unfiltered, milligrams per liter as nitrogen"

?


Create presentation-quality graph.  


Turbidity, water, unfiltered, monochrome near infra-red LED light, 780-900 nm, detection angle 90 +-2.5 degrees, formazin nephelometric units (FNU)


Graph of DAILY Turbidity, water, unfiltered, monochrome near infra-red LED light, 780-900 nm, detection angle 90 +-2.5 degrees, formazin nephelometric units (FNU)

Add up to 2 more sites and replot for "Turbidity, water, unfiltered, monochrome near infra-red LED light, 780-900 nm, detection angle 90 +-2.5 degrees, formazin nephelometric units (FNU)"

?


Create presentation-quality graph.