PROVISIONAL DATA SUBJECT TO REVISION
Click to hidestation-specific text
Funding for this site is provided by:
 Site Information
LOCATION.--Lat 42°18'30", long
74°23'24" referenced to North American Datum of 1983,
Greene County, NY, Hydrologic Unit 02020005, on right bank 200
ft southwest of State Highway 23 at Red Falls, 1.9 mi upstream
from mouth, and 2.2 mi southeast of Prattsville.
DRAINAGE AREA.--68.6 mi².
PERIOD OF RECORD.--October 1997 to current year.
GAGE.--Water-stage recorder and crest-stage gage. Datum of gage is 1,268.54 ft above NAVD of 1988.
REMARKS.--Flow regulated to some extent at high flows by three flood-retardation reservoirs, combined drainage area of 19.2 mi². Seasonal diversion for snowmaking by Ski Windam ski area at Windham.
Water Years 2014-23: Records fair except those for estimated daily discharges, which are poor.
EXTREMES FOR PERIOD OF RECORD.--Maximum discharge, 44,200 ft³/s, Aug. 28, 2011, gage height, about 20.0 ft, outside gage height was about 21.4 ft, from floodmarks, from rating curve extended above 2,900 ft³/s on basis of step-backwater analyses at gage heights about 11.4 ft and about 20.0 ft; minimum discharge, 0.08 ft³/s, Aug. 22, 2022, gage height, 1.05 ft; minimum gage height, 0.97 ft, Aug. 9, 2012.
EXTREMES OUTSIDE PERIOD OF RECORD.--Flood of Jan. 19, 1996, reached a stage of about 11.4 ft, from floodmark, discharge, 16,400 ft³/s, on basis of step-backwater analysis of peak flow.
 WaterAlert – get an
email or text (SMS) alert based on your chosen threshold.
WaterAlert – get an
email or text (SMS) alert based on your chosen threshold.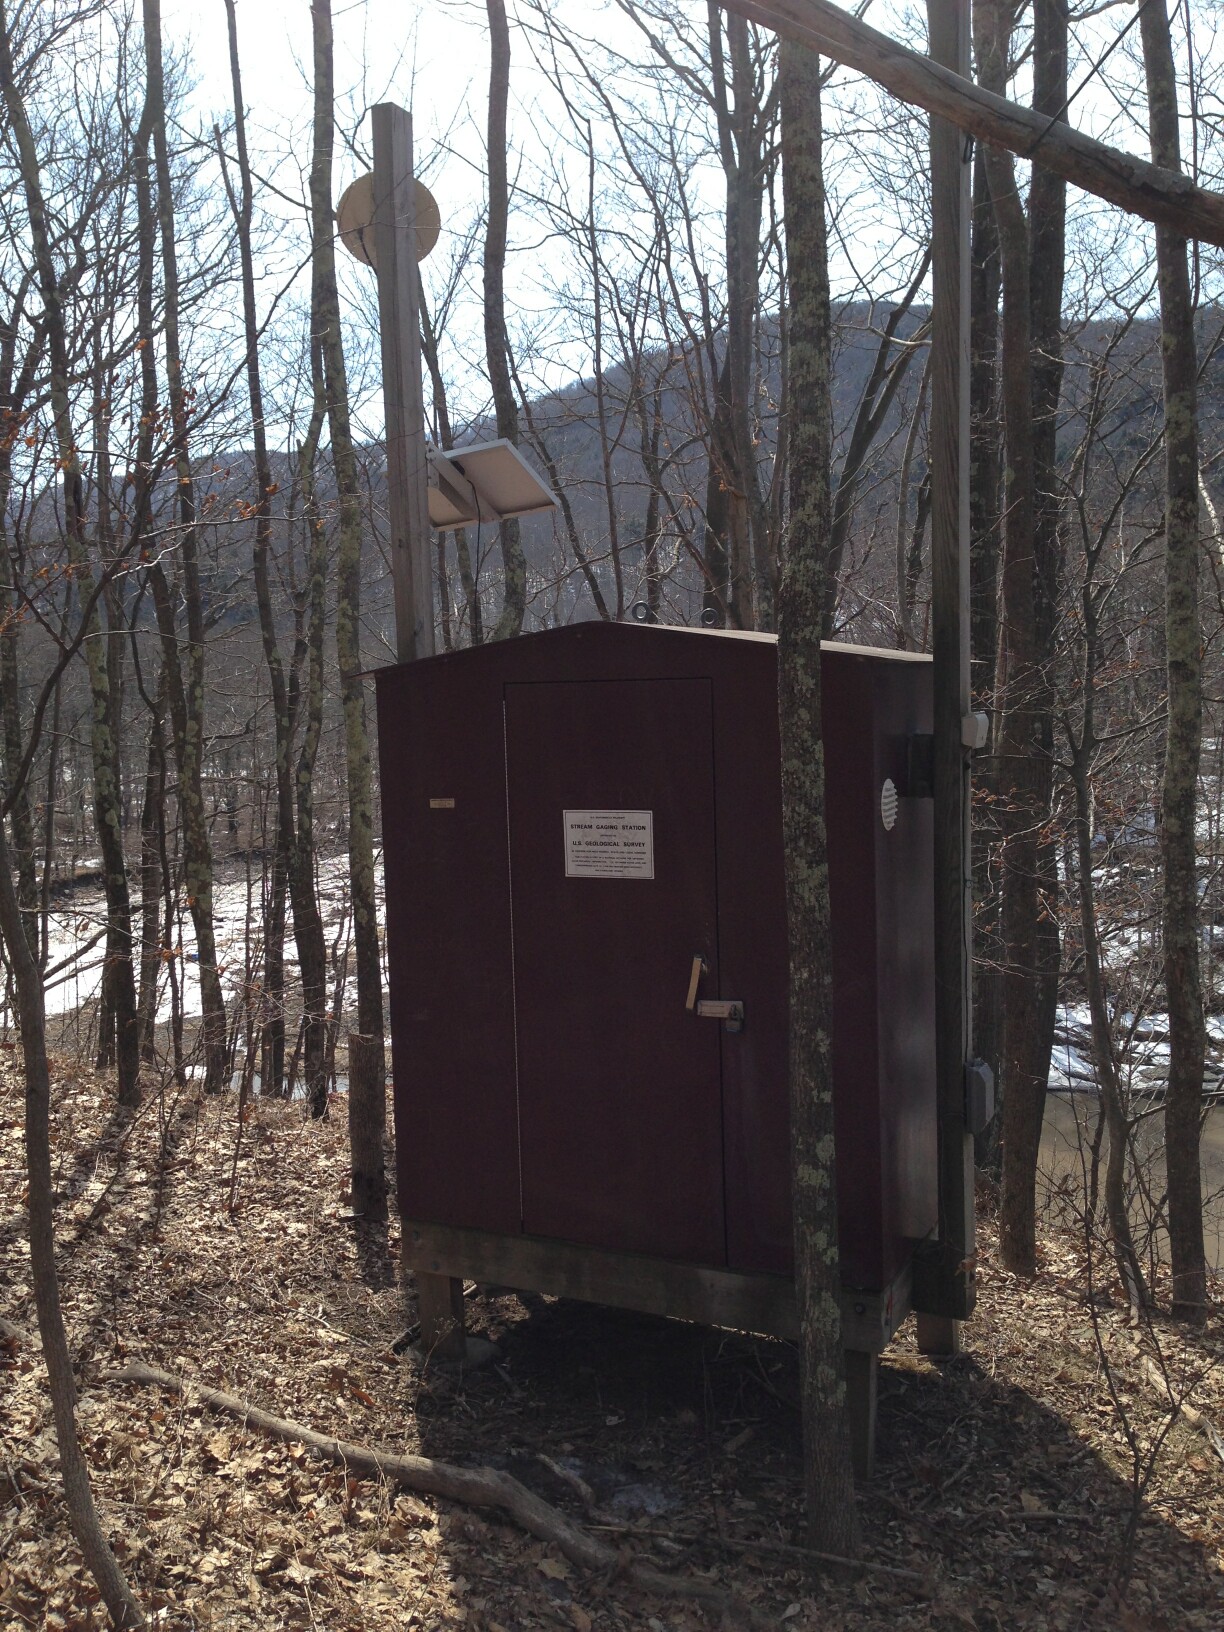 Station image
Summary of all available data for this site
Instantaneous-data availability statement

