PROVISIONAL DATA SUBJECT TO REVISION
Click to hidestation-specific text
Funding for this site is provided by:
 Site Information
LOCATION.--Lat 41°27'40.4", long
74°45'31.6" referenced to North American Datum of
1983, Sullivan County, NY, Hydrologic Unit 02040104, on right
bank 300 ft downstream from powerplant, 0.5 mi downstream from
Bush Kill, and 2.8 mi upstream from mouth and Mongaup.
DRAINAGE AREA.--200 mi².
PERIOD OF RECORD.--August 1939 to March 1995, October 2013 to current year.
REVISIONS HISTORY.--WDR NY-71-1: 1970. WDR NY-81-1: 1980. WDR NY-82-1: Drainage area. Gage height for the period Jan. 4, 2016, to Jan. 6, 2016, were revised on Oct. 3, 2022, based on backup data.
GAGE.--Water-stage recorder and crest-stage gage. Datum of gage is 625.05 ft above NGVD of 1929 (levels by Orange and Rockland Utilities, Inc.) and 623.49 ft above NAVD of 1988. Prior to July 6, 1956, water-stage recorders at sites 25 ft upstream on Rio tailrace and 200 ft upstream on natural channel, at datum 4.0 ft higher.
REMARKS.--Entire flow regulated by powerplant except for runoff from about 7 mi² of drainage area downstream from Rio Dam, and during periods of spill from Rio Reservoir. Flow also regulated by storage in Cliff Lake (station 01433200), Swinging Bridge Reservoir (station 01433000), and Toronto Reservoir (station 01433100) and small reservoirs upstream from station.
Water Years 2014-24: Records fair.
EXTREMES FOR PERIOD OF RECORD.--Maximum discharge, 16,100 ft³/s, Aug. 19, 1955, gage height, 11.22 ft, site and datum then in use, from rating curve extended above 7,900 ft³/s; minimum daily, 6 ft³/s, Oct. 1, 1939, minimum instantaneous discharge not determined.
EXTREMES OUTSIDE PERIOD OF RECORD.--Maximum discharge, about 10,000 ft³/s, Apr. 3, 2005, gage height, 11.9 ft, from floodmark in gage well.
PERIOD OF DAILY RECORD1.--SPECIFIC CONDUCTANCE: October 2013 to current year.
WATER TEMPERATURE: October 2013 to current year.
pH: October 2013 to current year.
DISSOLVED OXYGEN: October 2013 to current year.
INSTRUMENTATION1.--A continuous water-quality monitor with water temperature, specific conductance, pH, and dissolved oxygen provides 15-minute-interval readings.
EXTREMES FOR PERIOD OF DAILY RECORD1.--SPECIFIC CONDUCTANCE: Maximum, 234 uS/cm at 25 °C, Mar. 19, 2017; minimum, 83 uS/cm at 25 °C, Nov. 12, 2021. WATER TEMPERATURE: Maximum, 24.5 °C, Sept. 25, 27, 2017; minimum, 0.0 °C, Jan. 27, 2025. pH: Maximum, 8.8, Jan. 26, 31, 2015; minimum, 6.1, July 2, 2016. DISSOLVED OXYGEN: Maximum, 15.8 mg/L, Feb. 14, 18, 19, 22, 23, Mar. 3, 5, 2016; minimum, 3.0 mg/L, June 25, 2020.
1 Water-Quality Records
 WaterAlert – get an
email or text (SMS) alert based on your chosen threshold.
WaterAlert – get an
email or text (SMS) alert based on your chosen threshold.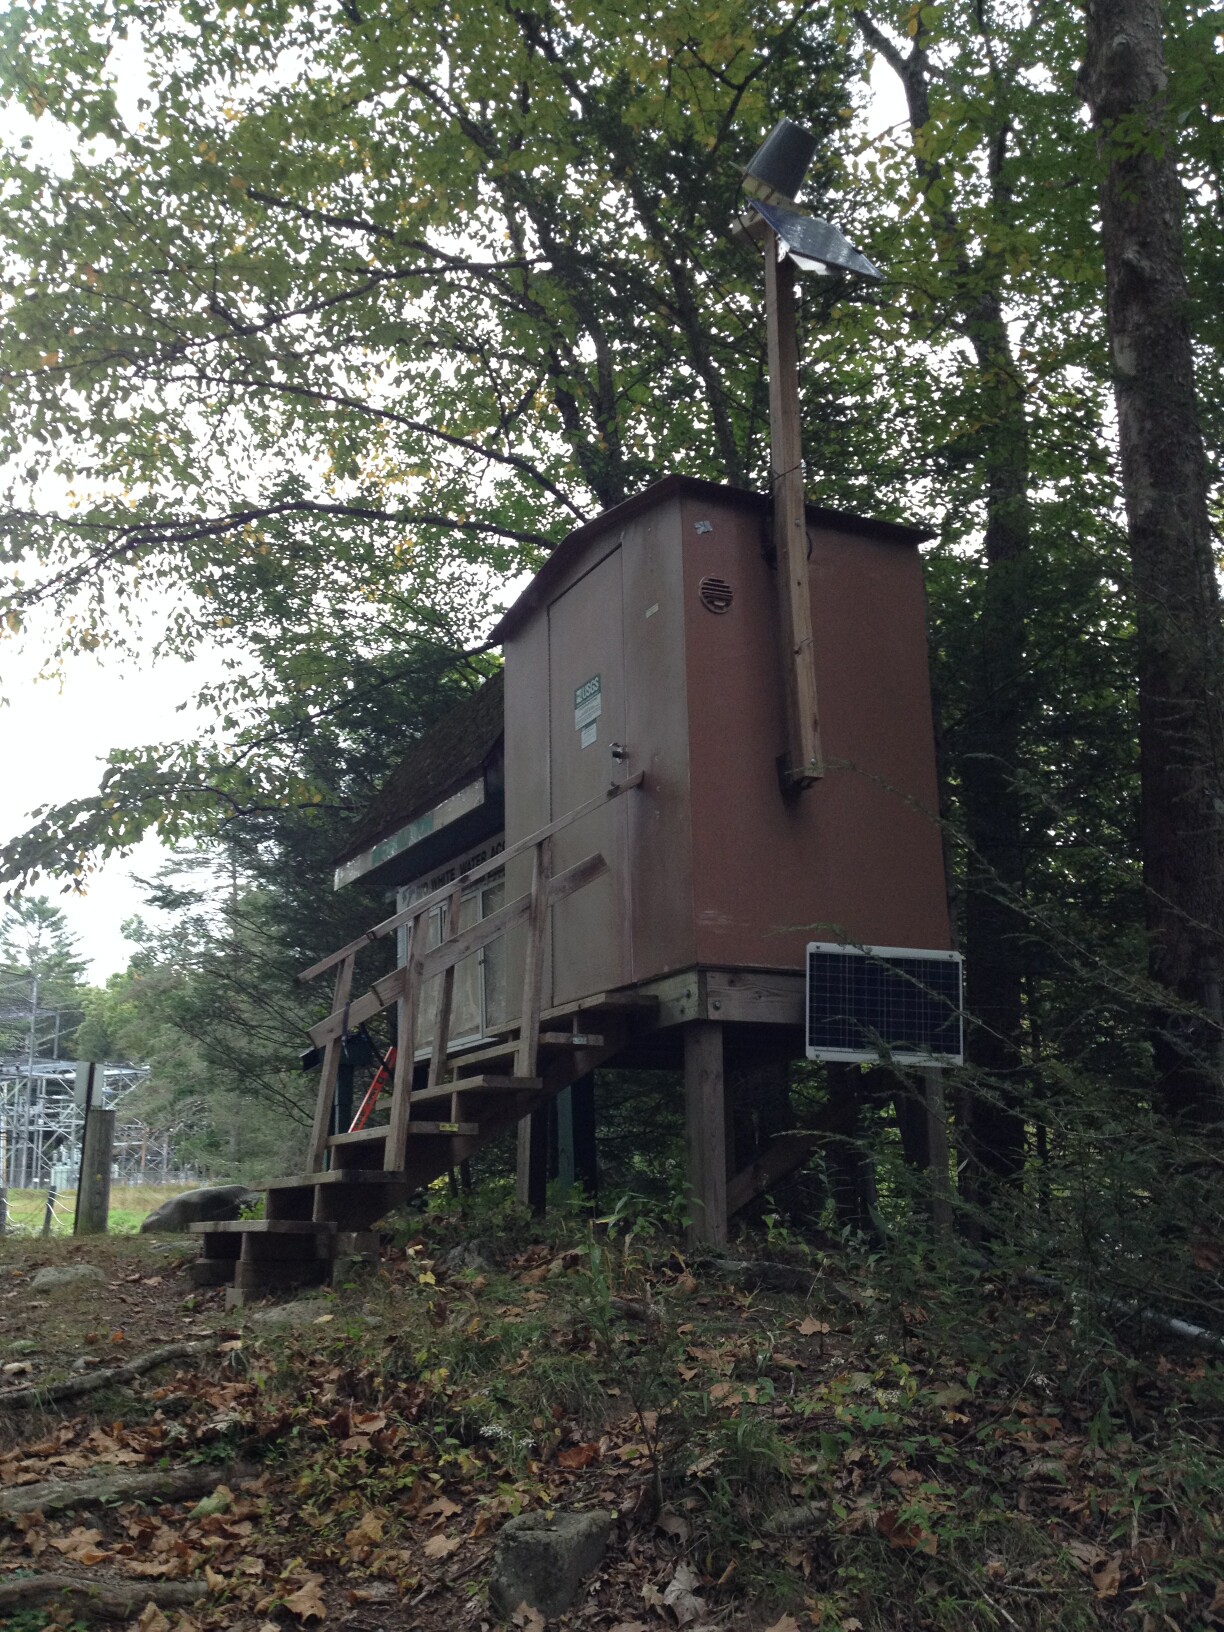 Station image
Summary of all available data for this site
Instantaneous-data availability statement


