PROVISIONAL DATA SUBJECT TO REVISION
Click to hidestation-specific text
|
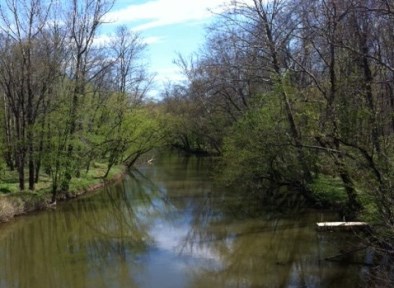 |
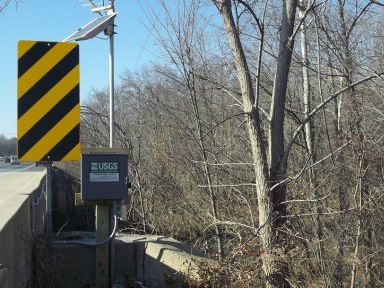
LOCATION.--Lat 38°57'21.3", long 76°41'37.3" Anne Arundel County, MD, Hydrologic Unit 02060006, on left bank
   upstream from bridge on U.S. Highway 50 (John Hanson Highway), 3.0 mi east of Bowie City Hall,
   3.1 mi downstream from mouth of Little Patuxent River, 4.2 mi northwest of Davidsonville, and 60 mi
   upstream from mouth.
DRAINAGE AREA.--348 mi2.
PERIOD OF RECORD.--April 1955 to June 1977 (gage heights and discharge measurements only), June 1977 to
   current year.
GAGE.--Water-stage recorder and crest-stage gage. Datum of gage is 12.32 ft above North American
   Vertical Datum of 1988. Prior to June 27, 1977, nonrecording gage at same site and gage datum.
REMARKS.--Flow regulated by T. Howard Duckett Reservoir, usable capacity 5,600,000,000 gal,
   21 mi upstream from station. U.S. Geological Survey satellite data-collection platform at station.
EXTREMES FOR PERIOD OF CONTINUOUS RECORD.--Maximum discharge, 16,800 ft3/s, Sept 08, 2011, gage height, 21.10 ft;
   minimum discharge, 52 ft3/s, Sept. 16, 1986.
EXTREMES OUTSIDE PERIOD OF CONTINUOUS RECORD.--Maximum discharge, 31,100 ft3/s, June 22, 1972, gage height, 27.90 ft,
   from floodmarks. Minimum discharge, 32 ft3/s, Aug. 9, 1966.
COOPERATION.--Funding for the operation of this station is provided by the U.S. Geological Survey.
| Boating safety tips |
Summary of all available data for this site
Instantaneous-data availability statement

