PROVISIONAL DATA SUBJECT TO REVISION
Click to hidestation-specific text
Funding for this site is provided by:
 Site Information
LOCATION.--Lat 43°48'49.3", long
76°04'28.0" referenced to North American Datum of
1983, Jefferson County, NY, Hydrologic Unit 04140102, on left
bank 250 ft upstream from bridge on Liberty Street, 0.2 mi
downstream from tributary, 2.5 mi downstream from Adams, and
10.0 mi upstream from mouth.
DRAINAGE AREA.--137 mi².
PERIOD OF RECORD.--August 1957 to March 1995, annual maximum only--1996-2002, June 2002 to current year.
REVISIONS HISTORY.--WDR NY-85-1: 1963-64(M), 1976-77(M), 1980(M), 1984(M). WDR NY-92-1: 1963, 1976-77, 1984.
GAGE.--Water-stage recorder and crest-stage gage. Datum of gage is 523.71 ft above NGVD of 1929 and 523.26 ft above NAVD of 1988.
REMARKS.--Moderate diurnal fluctuation at low flow caused by mills upstream from station.
Water Years 2014-23: Records good except those for estimated daily discharges, which are poor.
EXTREMES FOR PERIOD OF RECORD.--Maximum discharge, 7,700 ft³/s, Jan. 19, 1996, gage height, 11.06 ft, from floodmark in gage well; minimum discharge, 1.5 ft³/s, Sept. 17, 18, 1963, Aug. 19, 1964.
 WaterAlert – get an
email or text (SMS) alert based on your chosen threshold.
WaterAlert – get an
email or text (SMS) alert based on your chosen threshold.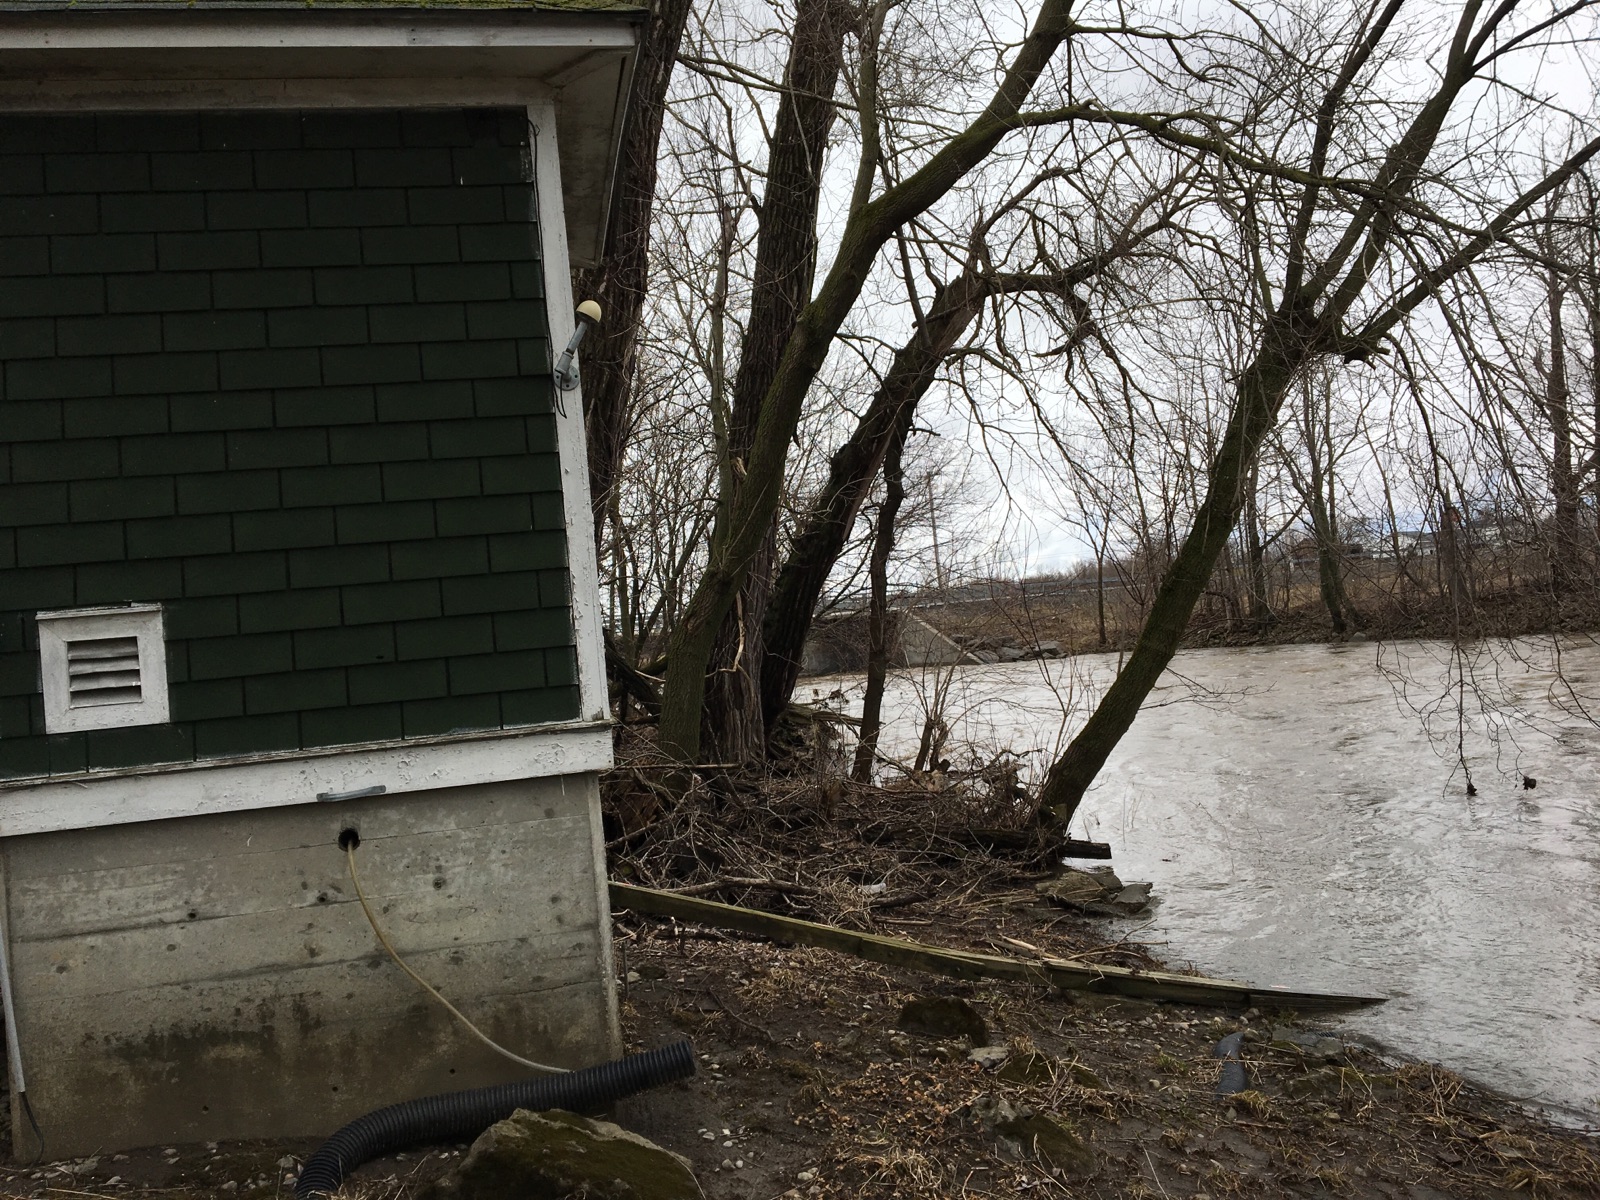 Station image
Summary of all available data for this site
Instantaneous-data availability statement

