USGS 03081000 Youghiogheny River below Confluence, PA

PROVISIONAL DATA SUBJECT TO REVISION

Click to hidestation-specific text
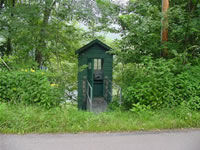


Station gage imageSTATION.--03081000 YOUGHIOGHENY RIVER BELOW CONFLUENCE, PA
LOCATION.--Lat 39`49'39", long 79`22'22", Fayette County, Hydrologic Unit 05020006, on left bank 1.0 mi downstream from Casselman River, 1.5 mi northwest of Confluence, and at mile 72.0.
DRAINAGE AREA.--1,029 square miles.
PERIOD OF RECORD.--June 1940 to current year. Monthly discharge only for June 1940, published in WSP 1305.
GAGE.--Water-stage recorder. Datum of gage is 1,302.3 ft above North American Vertical Datum of 1988. Prior to January 4, 2024, the datum of gage was reported as 1,302.77 ft above National Geodetic Vertical Datum of 1929. Satellite telemetry at station.
COOPERATION.--Funding for the operation of this station is provided by the Pennsylvania Department of Environmental Protection and the U.S. Geological Survey.
REMARKS.--Flow regulated since 1925 by Deep Creek Reservoir and since 1943 by Youghiogheny River Lake 1.7 mi upstream.
GAGE HEIGHTS OF IMPORTANCE.-
Supplied by NWS: Action stage-7 ft; Flood stage-12 ft; Moderate flood stage-14 ft; Major flood stage-17 ft.
This station managed by the PAWSC Pittsburgh Field Office.

Available Parameters Available Period
  
2007-10-01  2024-04-17
1990-10-01  2024-04-17
2007-10-01  2024-04-17
2007-10-01  2024-04-17
2007-10-01  2024-04-17
2007-10-01  2024-04-17
2021-10-01  2024-04-17


 (7)
 

  -- or --


Summary of all available data for this site
Instantaneous-data availability statement


Temperature, water, degrees Celsius

Most recent instantaneous value: 8.4 04-17-2024   21:45 EDT
Graph of  Temperature, water, degrees Celsius

Add up to 2 more sites and replot for "Temperature, water, degrees Celsius"

?


Create presentation-quality / stand-alone graph.   Subscribe to WaterAlert      

See this graph on the Monitoring Location Pages


Discharge, cubic feet per second

Most recent instantaneous value: 5230 04-17-2024   21:45 EDT
Graph of  Discharge, cubic feet per second

Add up to 2 more sites and replot for "Discharge, cubic feet per second"

?


Create presentation-quality / stand-alone graph.   Subscribe to WaterAlert      

See this graph on the Monitoring Location Pages


Daily discharge, cubic feet per second -- statistics for Apr 17 based on 83 water years of record more
Min
(1976)
25th
percen-
tile
Median Mean 75th
percen-
tile
Most Recent
Instantaneous
Value Apr 17
Max
(1972)
706 1320 2200 3040 3570 5230 13300


Gage height, feet

Most recent instantaneous value: 5.60 04-17-2024   21:45 EDT
Graph of  Gage height, feet

Add up to 2 more sites and replot for "Gage height, feet"

?


Create presentation-quality / stand-alone graph.   Subscribe to WaterAlert      

See this graph on the Monitoring Location Pages


Dissolved oxygen, water, unfiltered, milligrams per liter
 
-- Data temporarily unavailable for the time period specified --