PROVISIONAL DATA SUBJECT TO REVISION
Click to hidestation-specific text
Funding for this site is provided by:
 Site Information
-
LOCATION.--Lat 43°57'57.7", long 74°07'53.0" referenced to North American Datum of 1983, Essex County, NY, Hydrologic Unit 02020001, on left bank 25 ft upstream from bridge on State Highway 28N, 0.5 mi downstream from outlet of Harris Lake, 2.0 mi east of Newcomb, and 4.0 mi upstream from Wolf Creek.
DRAINAGE AREA.--192 mi².
PERIOD OF RECORD.--October 1925 to September 1987, annual maximum only--1988-2002, October 2002 to current year.
REVISIONS HISTORY.--WSP 696: 1928(M). WSP 711: 1930 (m).
GAGE.--Water-stage recorder. Datum of gage is 1,550.38 ft above NGVD of 1929 and 1,550.04 ft above NAVD of 1988. Prior to Aug. 6, 1931, nonrecording gage at site 180 ft downstream at same datum. Aug. 6, 1931 to Nov. 4, 1960, on left bank at site 55 ft downstream at same datum. Nov. 4, 1960 to Dec. 5, 1996, on right bank at site 55 ft downstream at same datum.
REMARKS.--Flow slightly regulated by small reservoirs upstream from station.
Water Years 2014-23: Records good except those for estimated daily discharges, which are fair. Water Year 2024: Records fair.
EXTREMES FOR PERIOD OF RECORD.--Maximum discharge, 11,500 ft³/s, Jan. 9, 1998, gage height, 12.84 ft; minimum discharge, 11 ft³/s, Sept. 3, 1934; minimum gage height, 0.46 ft, Sept. 26, 27, 1964.
 WaterAlert – get an email or text (SMS) alert based on your chosen threshold.
Additional Site Information
WaterAlert – get an email or text (SMS) alert based on your chosen threshold.
Additional Site Information
Click on time-lapse image to see the latest full size video. Click on the Static Image to view the latest image For mobile devices, click this link.
 |
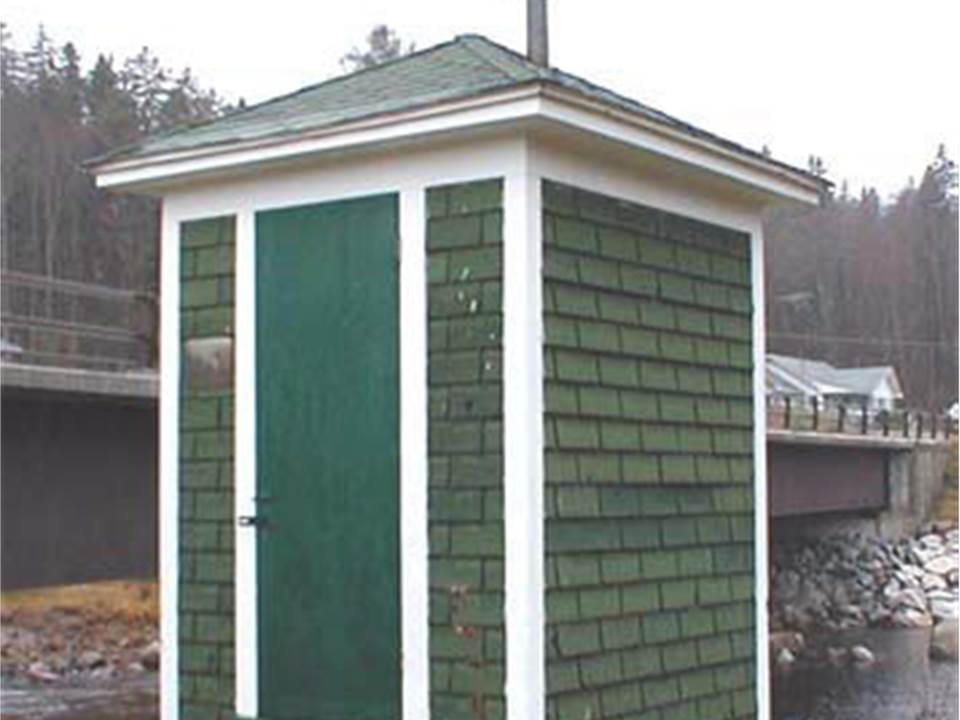 Station image
Summary of all available data for this site
Instantaneous-data availability statement

