PROVISIONAL DATA SUBJECT TO REVISION
Click to hidestation-specific text
Funding for this site is provided by:
 Site Information
LOCATION.--Lat 41°26'50.1", long
73°33'21.9" referenced to North American Datum of
1983, Putnam County, NY, Hydrologic Unit 02030101, on left bank
at downstream side of bridge on County Highway 65, 1.3 mi
southwest of Putnam Lake.
DRAINAGE AREA.--62.1 mi².
PERIOD OF RECORD.--October 1995 to current year.
REVISIONS HISTORY.--WDR NY-99-1: 1996(P). WDR NY-02-1: 2001. Discharge for the period Jan. 12, 2024, to Apr. 16, 2024, was revised on Apr. 21, 2025, based on changes to the stage-discharge rating.
GAGE.--Water-stage recorder and crest-stage gage. Datum of gage is 414.81 ft above NAVD of 1988.
REMARKS.--Water Years 2014-15, 2017-19: Records good except those for estimated daily discharges, which are poor.
Water Years 2016, 2020-24: Records fair except those for estimated daily discharges, which are poor.
EXTREMES FOR PERIOD OF RECORD.--Maximum discharge, 2,650 ft³/s, Mar. 7, 2011, gage height, 11.64 ft; minimum discharge, 0.01 ft³/s, Sept. 4, 5, 2022, gage height, 1.85 ft.
 WaterAlert – get an
email or text (SMS) alert based on your chosen threshold.
WaterAlert – get an
email or text (SMS) alert based on your chosen threshold.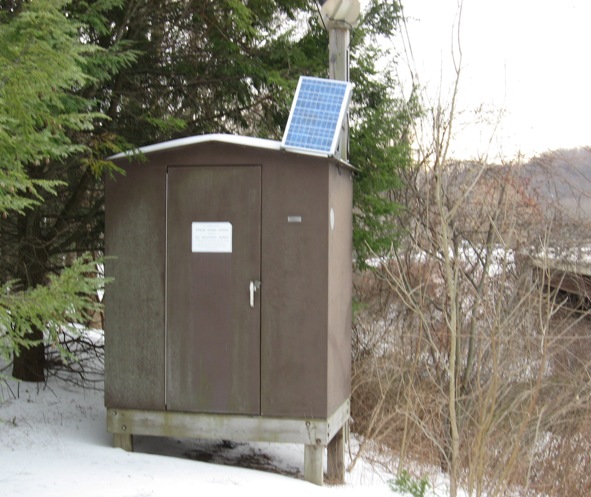 Station image
Summary of all available data for this site
Instantaneous-data availability statement

