PROVISIONAL DATA SUBJECT TO REVISION
Click to hidestation-specific text
Funding for this site is provided by:
 Site Information
LOCATION.--Lat 42°15'08.6", long
74°54'03.8" referenced to North American Datum of
1983, Delaware County, NY, Hydrologic Unit 02040101, on left
bank 10 ft downstream from bridge on Thomson Cross Road, 0.7 mi
downstream from Toll Gate Brook, 1.5 mi upstream from mouth,
and 2.0 mi south of Delhi.
DRAINAGE AREA.--49.8 mi².
PERIOD OF RECORD.--October 1937 to September 1970, annual maximum only--1971-74, 1996, maximum only--October to December 1996, January 1997 to current year.
GAGE.--Water-stage recorder and crest-stage gage. Datum of gage is 1,385.35 ft above NGVD of 1929 and 1,384.77 ft above NAVD of 1988. Since January 1997, gage-height record collected at upstream side of bridge, but gage house still downstream from bridge. Prior to Dec. 7, 1939, nonrecording gages at several temporary sites within a quarter of a mile of present site at various datums.
REMARKS.--Water Years 2014-24: Records fair except those for estimated daily discharges, which are poor.
EXTREMES FOR PERIOD OF RECORD.--Maximum discharge, about 6,100 ft³/s, Jan. 19, 1996, gage height, 8.51 ft, from floodmark, from rating curve extended above 2,200 ft³/s; maximum gage height since January 1997, 8.55 ft, Jan. 1, 2001 (ice jam); minimum discharge, 0.8 ft³/s, Aug. 10, 11, 12, Sept. 24, 25, 1964; minimum gage height, 1.29 ft, Sept. 24, 25, 1964.
 WaterAlert – get an
email or text (SMS) alert based on your chosen threshold.
WaterAlert – get an
email or text (SMS) alert based on your chosen threshold.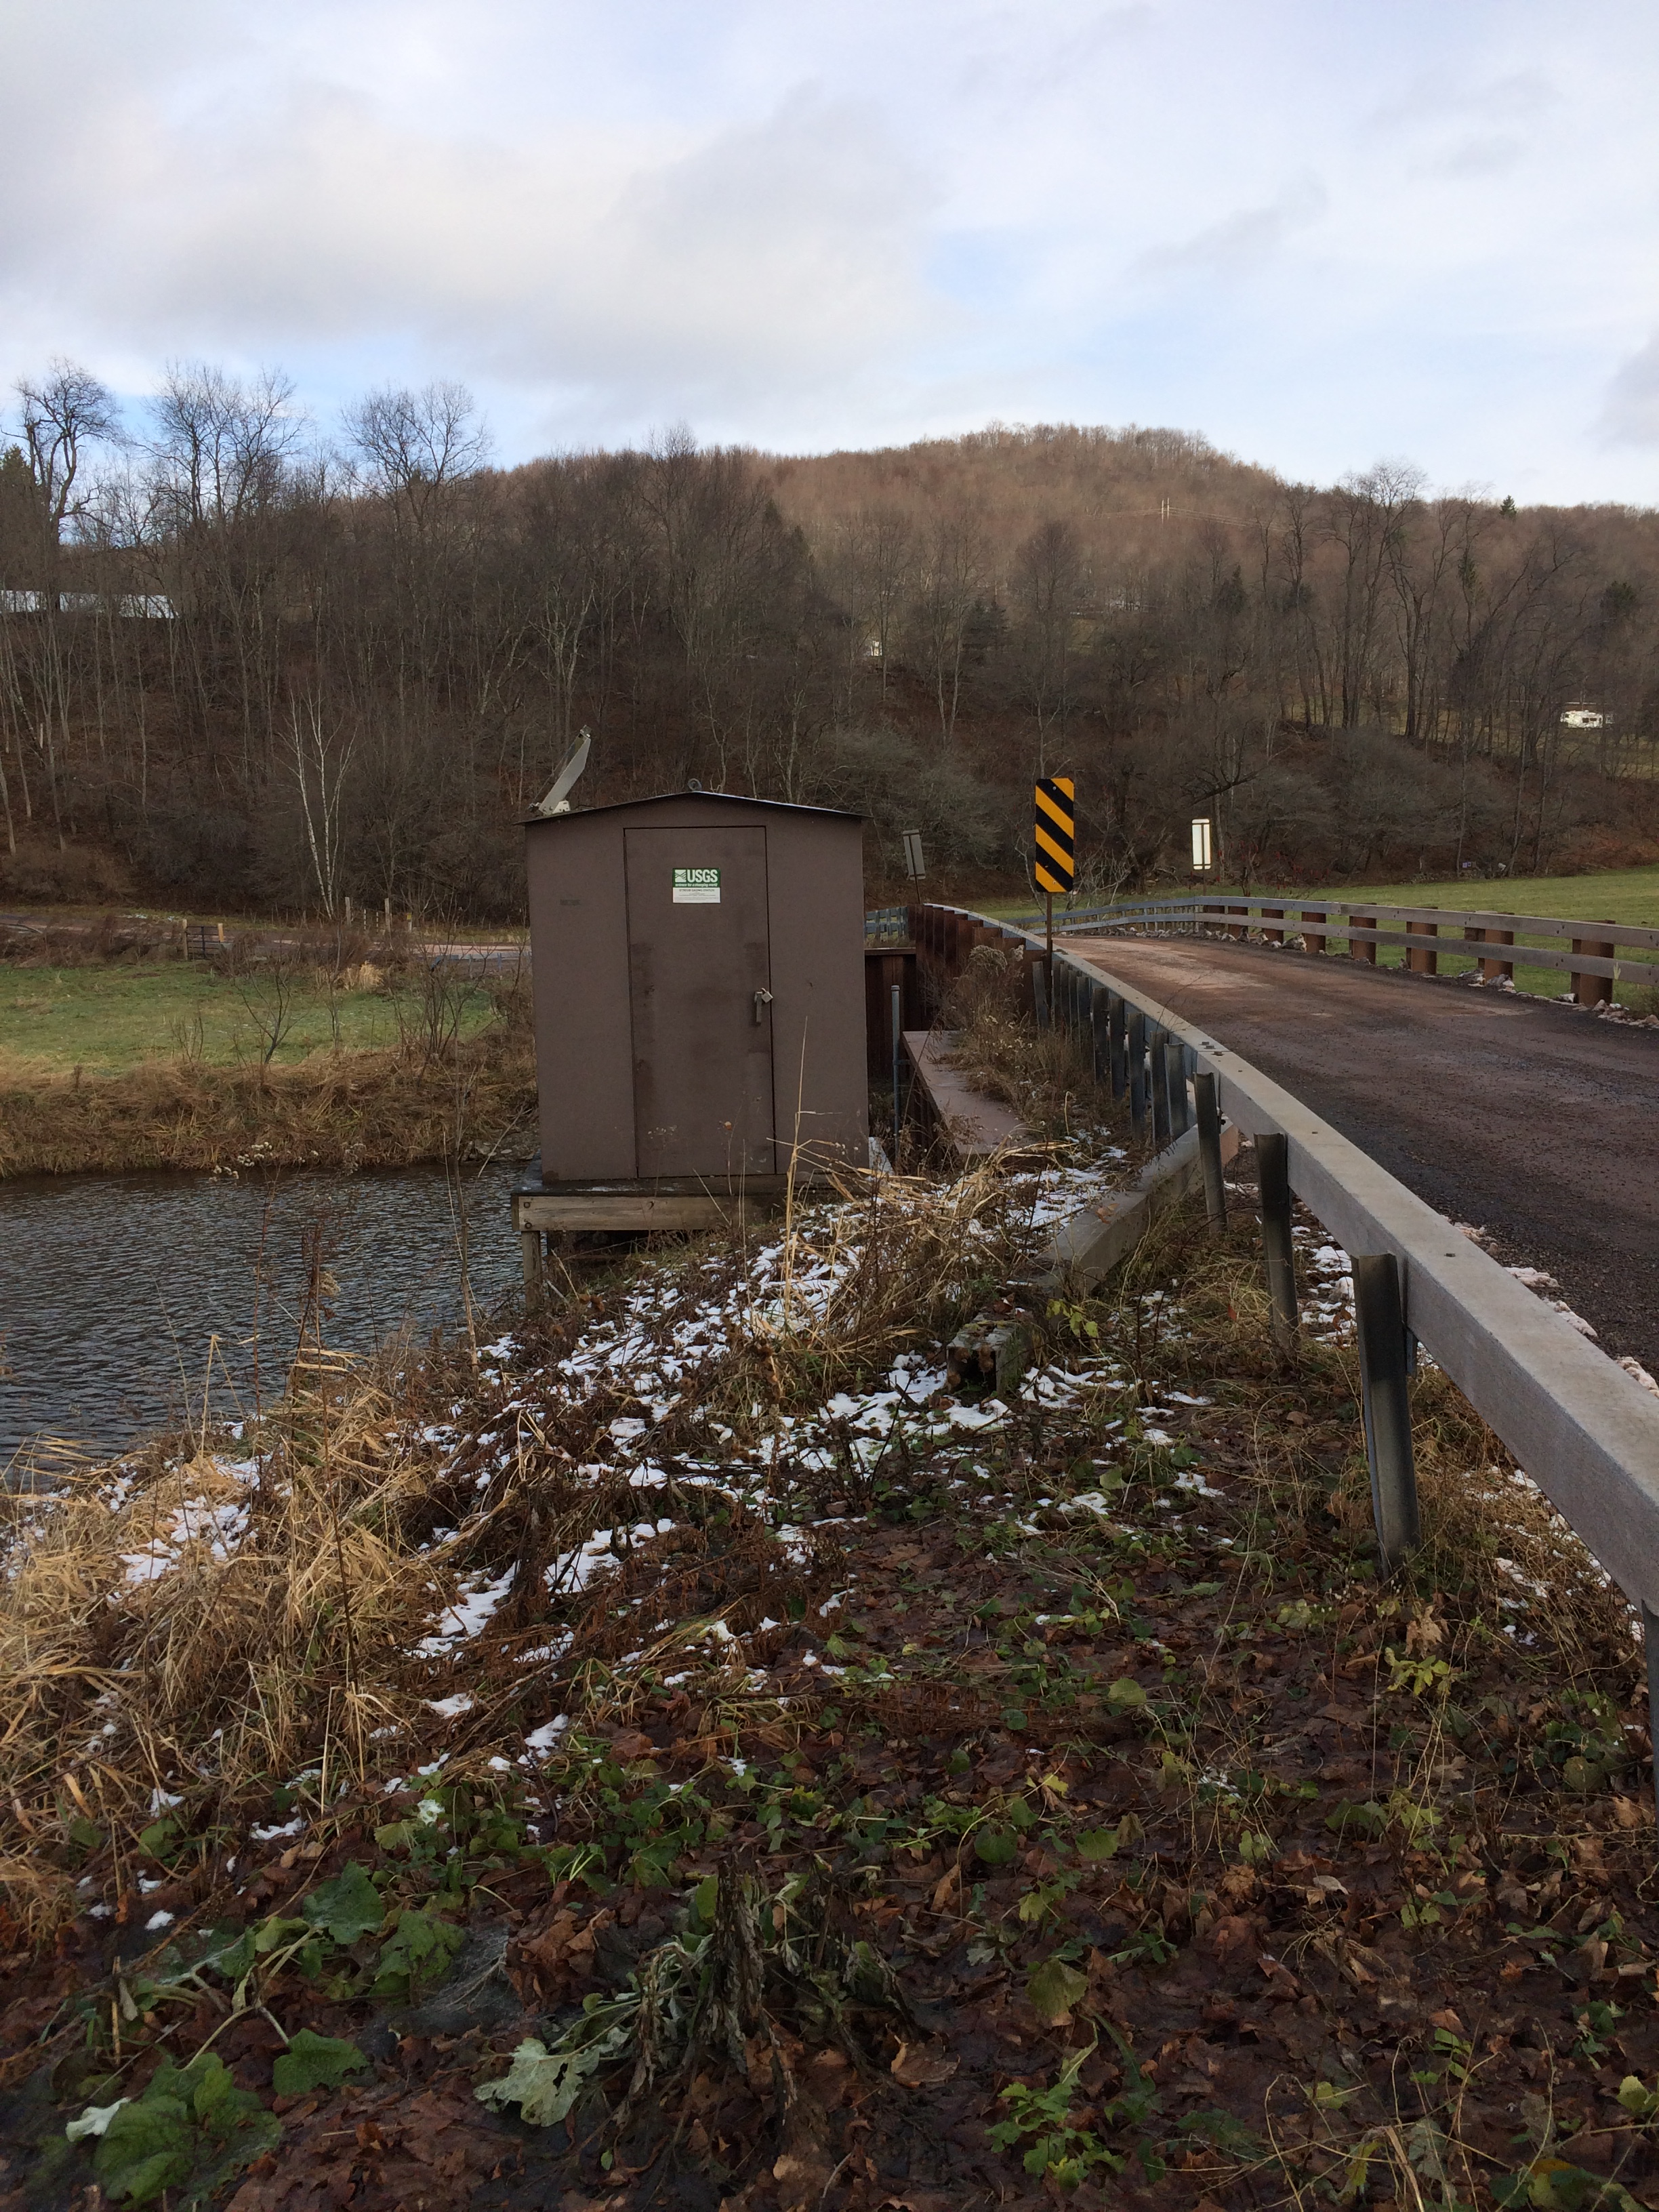 Station image
Summary of all available data for this site
Instantaneous-data availability statement

