PROVISIONAL DATA SUBJECT TO REVISION
Click to hidestation-specific text
Funding for this site is provided by:
 Site Information
LOCATION.--Lat 41°49'12", long
74°38'08" referenced to North American Datum of 1983,
Sullivan County, NY, Hydrologic Unit 02040104, on right bank at
downstream end of outlet channel, 1,650 ft downstream from
Neversink Dam and State Highway 55, 2.0 mi southwest of
Neversink, and 2.6 mi upstream from Wynkoop Brook.
DRAINAGE AREA.--92.6 mi².
PERIOD OF RECORD.--October 1941 to current year.
REVISIONS HISTORY.--WDR NY-72-1: 1961 (M), 1968 (M). WDR NY-82-1: Drainage area.
GAGE.--Water-stage recorder and concrete control. Datum of gage is 1,255.24 ft above NGVD of 1929 (levels by Board of Water Supply, City of New York) and 1,253.99 ft above NAVD of 1988. Prior to Jan. 17, 1953, at site 650 ft downstream at datum 0.20 ft lower. Jan. 17, 1953 to Apr. 16, 1954, at present site at datum 0.41 ft higher.
REMARKS.--Subsequent to June 1953, entire flow from 92.5 mi² of drainage area controlled by Neversink Reservoir (station 01435900). Part of flow diverted for New York City municipal supply. Remainder of flow (except for conservation release and spill) impounded for release during periods of low flow in the lower Delaware River basin, as directed by the Delaware River Master.
Water Years 2014-23: Records good. Water Year 2024: Records fair except those for estimated daily discharges, which are poor.
EXTREMES FOR PERIOD OF RECORD.--Maximum discharge, since construction of Neversink Reservoir in 1953, 12,300 ft³/s, Apr. 3, 2005, gage height, 12.99 ft, outside gage height was about 14.8 ft, from floodmark, from rating curve extended above 6,000 ft³/s; no flow for all or part of each day Sept. 22-24, Oct. 26-29, 1954.
EXTREMES FOR PERIOD PRIOR TO REGULATION.--Maximum discharge, prior to construction of Neversink Reservoir in 1953, 22,300 ft³/s, Nov. 25, 1950, gage height, 11.23 ft, site and datum then in use, from rating curve extended above 2,600 ft³/s on basis of contracted-opening and critical-depth measurements of peak flow; maximum gage height, 11.65 ft, Sept. 27, 1942, site and datum then in use.
PERIOD OF RECORD1.--SPECIFIC CONDUCTANCE: December 2019 to current year. WATER TEMPERATURE: July 2019 to current year.
INSTRUMENTATION1.--A continuous water-quality monitor with water temperature and specific conductance provides 15-minute-interval readings.
EXTREMES FOR PERIOD OF DAILY RECORD1.--SPECIFIC CONDUCTANCE: Maximum, 42.9 uS/cm at 25 °C, Dec. 18, 2023; minimum, 7 uS/cm at 25 °C, Apr. 13, 2020. WATER TEMPERATURE: Maximum, 22.9 °C, July 17, 18, 2021; minimum, 0.3 °C, Feb. 18, 2025.
1 Water-Quality Records
 WaterAlert – get an
email or text (SMS) alert based on your chosen threshold. Additional Site
Information
WaterAlert – get an
email or text (SMS) alert based on your chosen threshold. Additional Site
Information
USGS provisional real-time discharge
data can differ from NYCDEP discharge data at flows less than
300 ft3/s as a result of debris or other
obstructions affecting the USGS stage-discharge relationship.
USGS and NYCDEP data may also differ as a result of accuracy
limitations of the stage-discharge rating and the release valve
ratings. Release valve changes are recorded at the
stream-gaging station after a brief period due to travel time
between the two locations.
More information about provisional data can be found at
https://waterdata.usgs.gov/nwis/help/?provisional
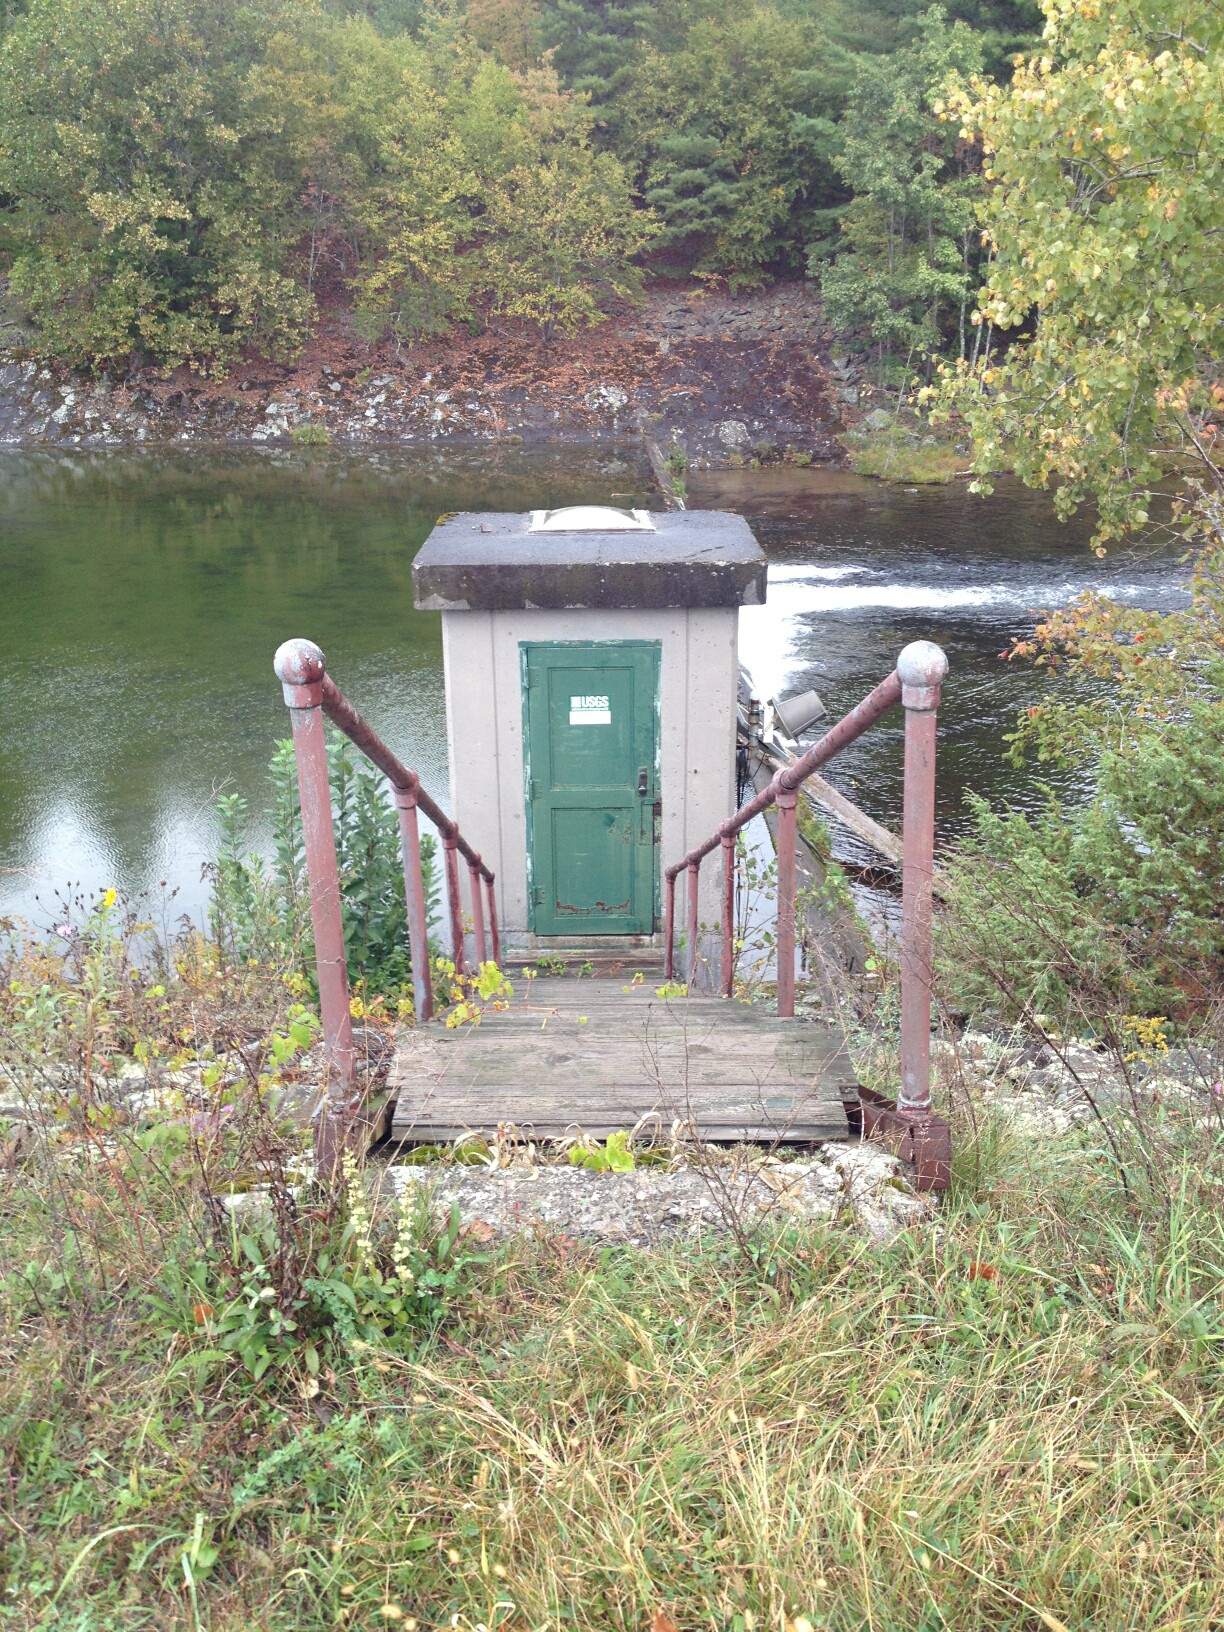 Station image
Summary of all available data for this site
Instantaneous-data availability statement


