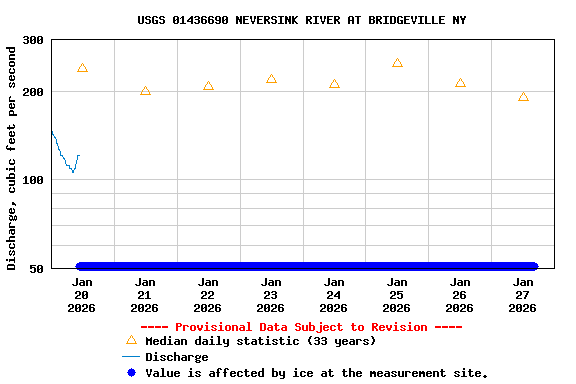
PROVISIONAL DATA SUBJECT TO REVISION
Click to hidestation-specific text
Funding for this site is provided by:
 Site Information
LOCATION.--Lat 41°38'17.0", long
74°37'00.8" referenced to North American Datum of
1983, Sullivan County, NY, Hydrologic Unit 02040104, on left
bank 0.1 mi upstream from State Highway 17 bridge, and 0.25 mi
upstream from Bridgeville.
DRAINAGE AREA.--171 mi².
PERIOD OF RECORD.--October 1992 to current year.
GAGE.--Water-stage recorder and crest-stage gage. Datum of gage is 1,056.14 ft above NGVD of 1929 and 1,055.56 ft above NAVD of 1988.
REMARKS.--Entire flow from 92.5 mi² of drainage area controlled by Neversink Reservoir (station 01435900). Part of flow diverted for New York City municipal supply. Remainder of flow (except for conservation releases and spill) impounded for release during periods of low flow in the lower Delaware River basin, as directed by the Delaware River Master. Occasional regulation by Pleasure Lake at South Fallsburg.
Water Years 2014-23: Records good except those for estimated daily discharges, which are poor. Water Year 2024: Records fair except those for estimated daily discharges, which are poor.
EXTREMES FOR PERIOD OF RECORD.--Maximum discharge, 25,900 ft³/s, Apr. 3, 2005, gage height, 21.25 ft, from floodmark in gage house; minimum discharge, 20 ft³/s, Dec. 31, 1998, result of freezeup; minimum gage height, 4.25 ft, Jan. 19, 2002, result of freezeup.
PERIOD OF DAILY RECORD1.--WATER TEMPERATURE: October 1992 to November 2024. SPECIFIC CONDUCTANCE: January 2020 to September 2024.
INSTRUMENTATION1.--A continuous water-quality monitor with water temperature and specific conductance provides 15-minute-interval readings. Prior to May 1993, satellite telemeter provided one-hour-interval readings.
REMARKS1.--Temperature readings prior to Oct. 1, 2007, rounded to the nearest 0.5 °C.
EXTREMES FOR PERIOD OF DAILY RECORD1.--WATER TEMPERATURE: Prior to Oct. 1, 2007--Maximum, 26.5 °C, July 15, 1995; minimum, 0.0 °C on many days during winter periods. WATER TEMPERATURE: After Oct. 1, 2007--Maximum, 25.4 °C, July 7, 8, 2010; minimum, -0.2 °C, Feb. 16, 17, 2016. SPECIFIC CONDUCTANCE: Maximum, 248 uS/cm at 25 °C, Feb. 17, 2021; minimum, 32 uS/cm at 25 °C, Aug. 24, 2022.
1 Water-Quality Records
 WaterAlert – get an
email or text (SMS) alert based on your chosen threshold.
WaterAlert – get an
email or text (SMS) alert based on your chosen threshold.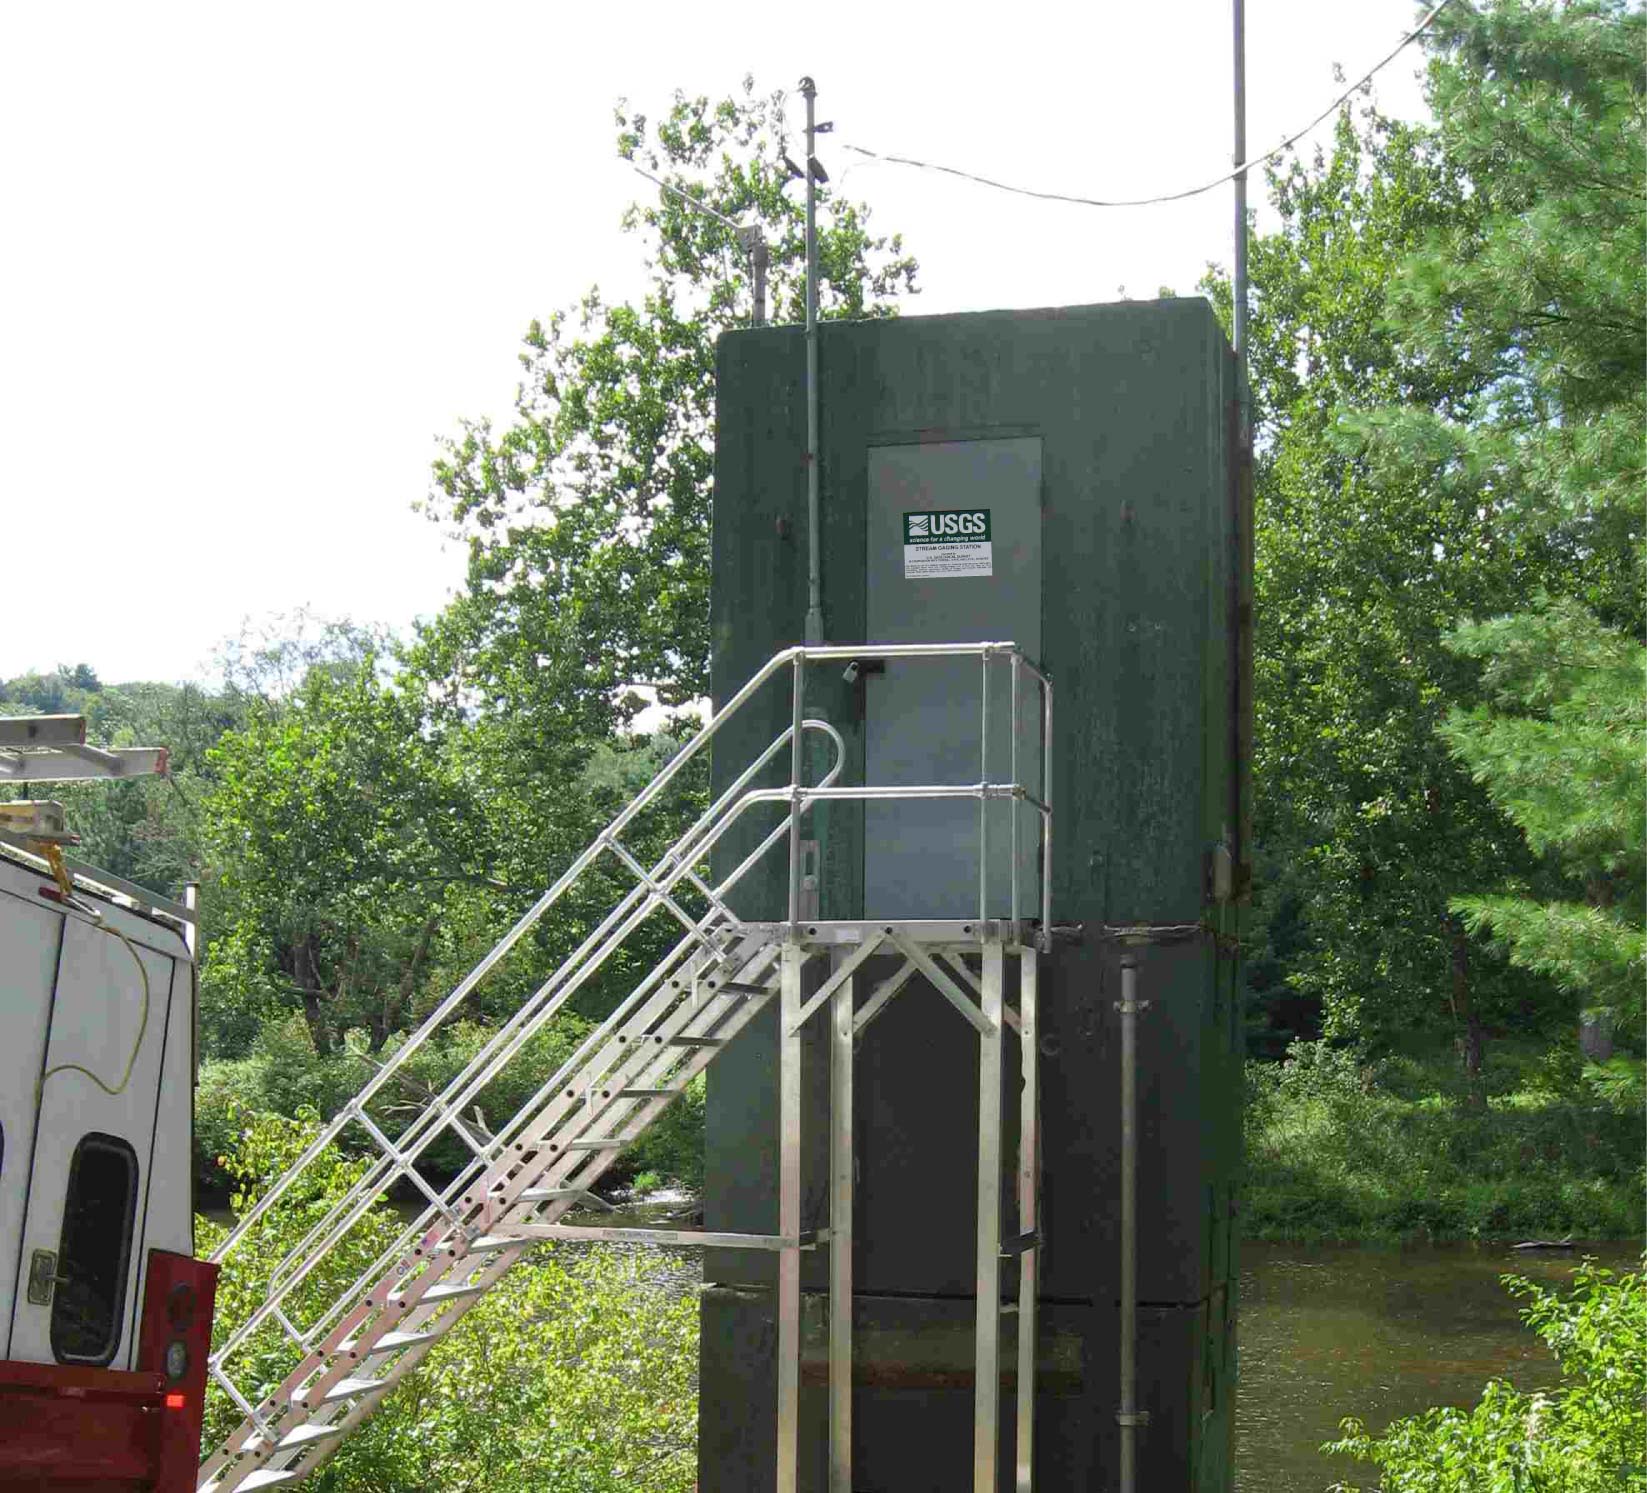 Station image
Summary of all available data for this site
Instantaneous-data availability statement