PROVISIONAL DATA SUBJECT TO REVISION
Click to hidestation-specific text
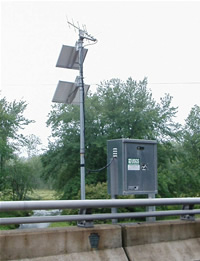 STATION.--01439590 LITTLE BUSH KILL AT EDGEMERE,
PA
STATION.--01439590 LITTLE BUSH KILL AT EDGEMERE,
PALOCATION.--Lat 41`15'31", long 74`59'45", Pike County, Hydrologic Unit 02040104, on right bank at downstream side of bridge on SR 2004, about 12.5 mi above mouth, at Edgemere.
DRAINAGE AREA.--7.27 square miles.
PERIOD OF RECORD.--October 2005 to current year.
GAGE.--Water-stage recorder and crest stage gage. Datum of gage is 1,270 ft above National Geodetic Vertical Datum of 1929, from topographic map. Satellite telemetry at station.
COOPERATION.--Station established and maintained by the U.S. Geological Survey in cooperation with the Pennsylvania Department of Conservation and Natural Resources, Topographic and Geologic Survey.
GAGE HEIGHTS OF IMPORTANCE.-
Supplied by USGS: Data transmitter operational limit - 18.9 ft;
Supplied by NWS: No flood stage has been determined for this station.
Summary of all available data for this site
Instantaneous-data availability statement

