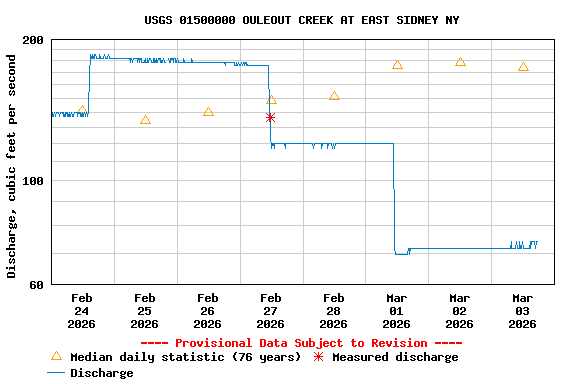
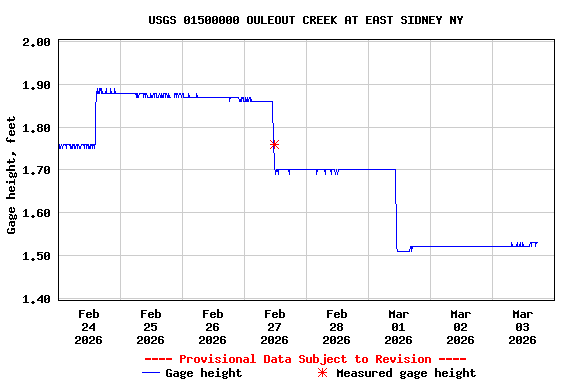
PROVISIONAL DATA SUBJECT TO REVISION
Click to hidestation-specific text
Funding for this site is provided by:
 Site Information
LOCATION.--Lat 42°19'59.3", long
75°14'03.5" referenced to North American Datum of
1983, Delaware County, NY, Hydrologic Unit 02050101, on right
bank 0.2 mi downstream from bridge on County Highway 44, 0.4 mi
downstream from East Sidney Dam, at East Sidney, and 3.5 mi
upstream from mouth.
DRAINAGE AREA.--103 mi².
PERIOD OF RECORD.--August 1940 to current year.
REVISIONS HISTORY.--WSP 2103: Drainage area.
GAGE.--Water-stage recorder. Datum of gage is 1,086.23 ft above NGVD of 1929 and 1,085.82 ft above NAVD of 1988. Prior to June 13, 1947, at site 0.5 mi upstream at datum 27.30 ft higher.
REMARKS.--Since November 1949, flow regulated by East Sidney Lake (station 01499500).
Water Years 2014-24: Records good except those for estimated daily discharges, which are poor.
EXTREMES FOR PERIOD OF RECORD.--Maximum discharge, since construction of East Sidney Lake in 1950, 4,000 ft³/s, Apr. 7, 1960, gage height, 6.19 ft; minimum instantaneous discharge not determined.
EXTREMES OUTSIDE PERIOD OF RECORD.--A discharge of 16,700 ft³/s, in July 1935, was determined by computation of flow-over-dam measurement of peak flow and from floodmarks.
EXTREMES FOR PERIOD PRIOR TO REGULATION.--Maximum discharge, prior to construction of East Sidney Lake in 1950, 7,250 ft³/s, Dec. 30, 1942, gage height, 7.62 ft, site and datum then in use; minimum daily discharge, 1.2 ft³/s, gage height, 0.32 ft, Aug. 13, 14, 17, 1949, result of construction; minimum instantaneous discharge not determined.
 WaterAlert – get an
email or text (SMS) alert based on your chosen threshold.
WaterAlert – get an
email or text (SMS) alert based on your chosen threshold.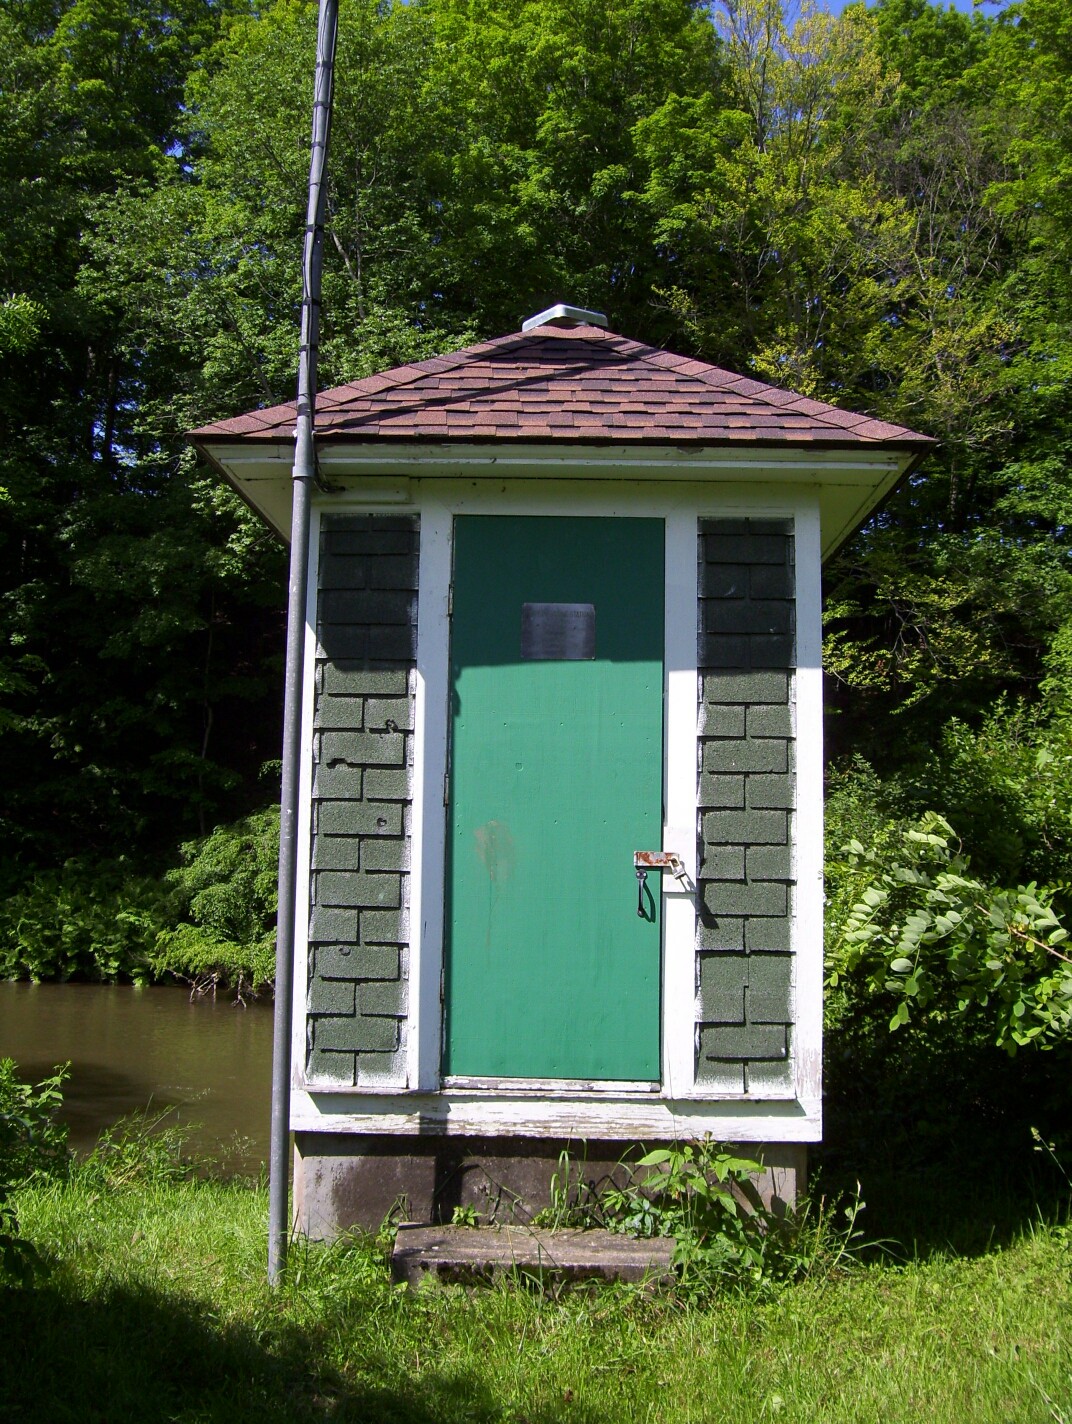 Station image
Summary of all available data for this site
Instantaneous-data availability statement