PROVISIONAL DATA SUBJECT TO REVISION
Click to hidestation-specific text
Funding for this site is provided by:
 Site Information
LOCATION.--Lat 42°04'20", long
77°17'56" referenced to North American Datum of 1983,
Steuben County, NY, Hydrologic Unit 02050104, on right bank 500
ft downstream from bridge on State Highway 417, 200 ft upstream
from Elk Creek, and 1.7 mi southwest of South Addison.
DRAINAGE AREA.--102 mi².
PERIOD OF RECORD.--Annual maximum only--1989-2000, October 2000 to current year.
REVISIONS HISTORY.--WDR NY-01-3: 1991 (M).
GAGE.--Water-stage recorder. Datum of gage is 1,078.95 ft above NGVD of 1929 and 1,078.45 ft above NAVD of 1988.
REMARKS.--Water Years 2014-17: Records good except those for estimated daily discharges, which are fair. Water Years 2018-19: Records fair except those for estimated daily discharges, which are poor. Water Year 2020: Records poor. Water Years 2021-24: Records fair except those for estimated daily discharges, which are poor.
EXTREMES FOR PERIOD OF RECORD.--Maximum discharge, 27,400 ft³/s, Aug. 18, 2021, gage height, 14.28 ft, from rating curve extended above 11,000 ft³/s on basis of slope-area measurement of peak flow; minimum discharge, 0.02 ft³/s, Aug 27, 28, 29, 2005.
 WaterAlert – get an
email or text (SMS) alert based on your chosen threshold.
WaterAlert – get an
email or text (SMS) alert based on your chosen threshold.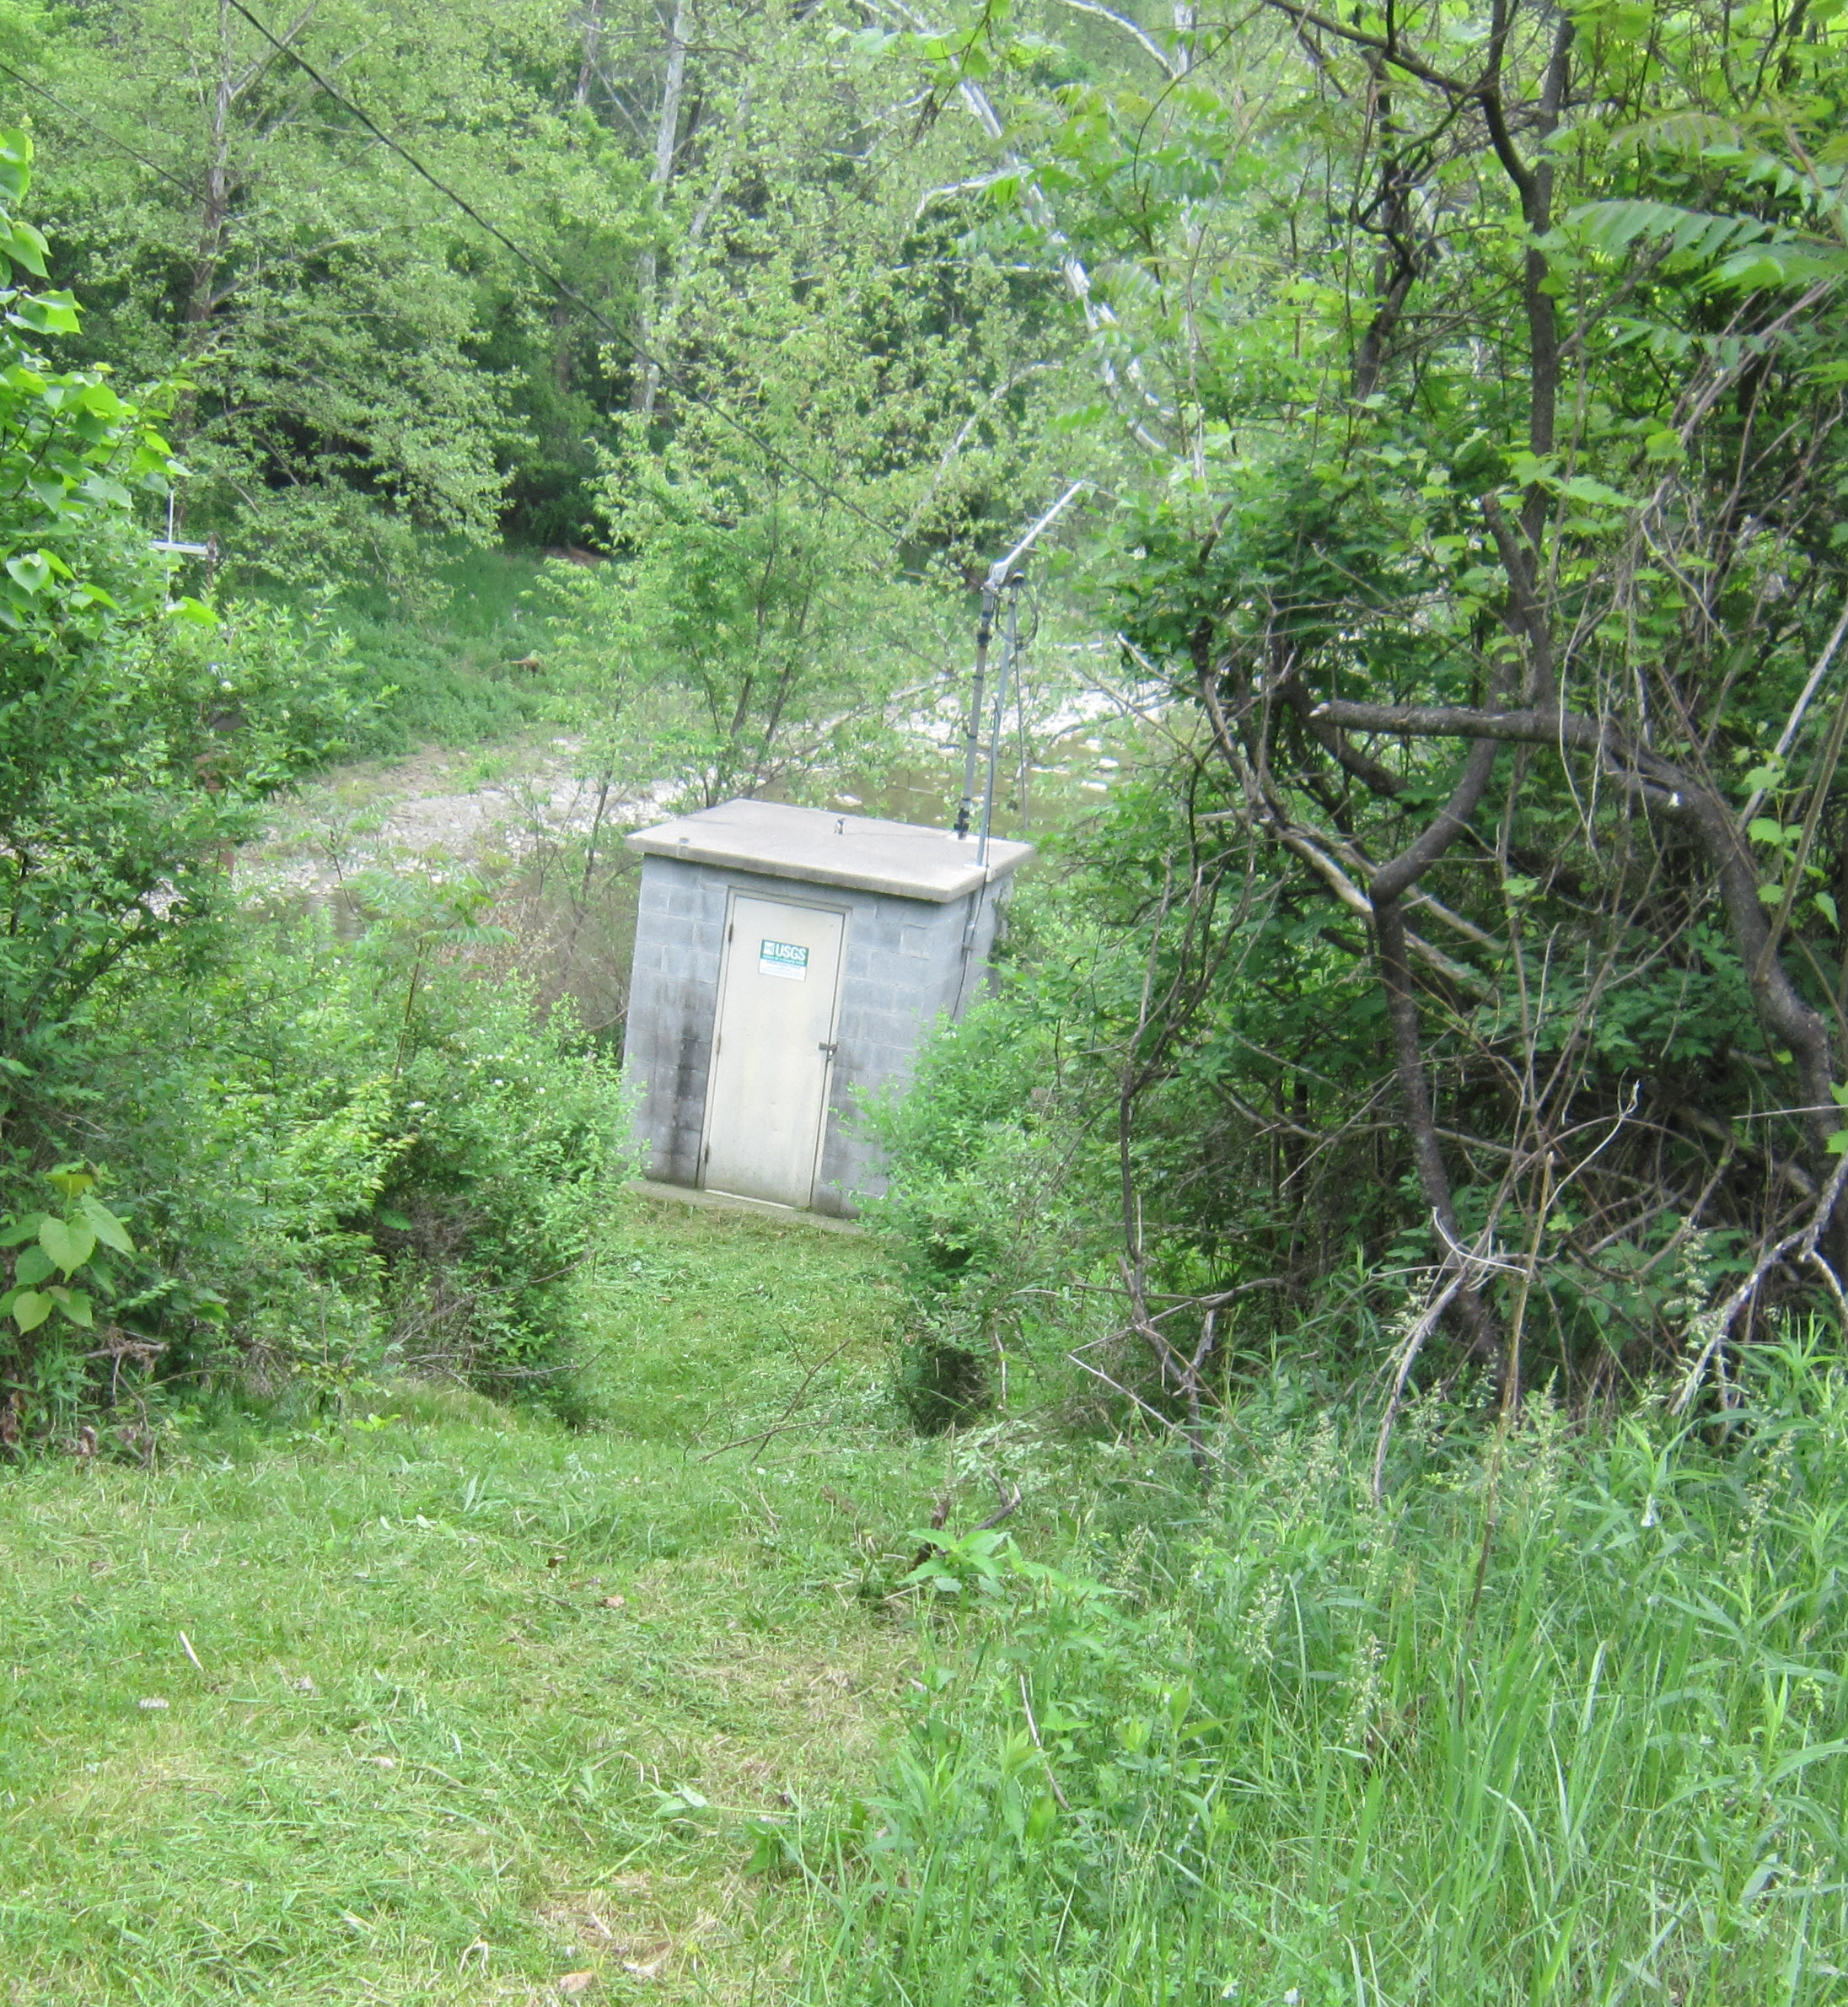 Station image
Summary of all available data for this site
Instantaneous-data availability statement

