PROVISIONAL DATA SUBJECT TO REVISION
Click to hidestation-specific text
Funding for this site is provided by:
 STATION.--01564512 AUGWICK CREEK NEAR SHIRLEYSBURG,
PA
 LOCATION.--Lat 40`16'55", long 77`53'27", Huntingdon County, Hydrologic Unit 02050304, on left bank 0.2 mi upstream from Sugar Run, and 1.2 mi southwest of Shirleysburg.
DRAINAGE AREA.--301 square miles.
PERIOD OF RECORD.--Continuous-record gaging station October 2017 to current year. Operated as a Continuous-record, annual-peak site (annual maximum only) 1990 through September 2017.
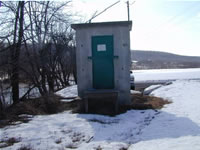
GAGE.--Water-stage recorder and crest-stage gage. Datum of gage is 570 ft above National Geodetic Vertical Datum of 1929, from topographic map. Satelite and landline telemetry at station.
COOPERATION.--Station established and maintained by the U.S. Geological Survey in cooperation with the Pennsylvania Department of Environmental Protection.
REMARKS.--Daily discharge not available prior to October 2017.
GAGE HEIGHTS OF IMPORTANCE.-
Supplied by USGS: Data transmitter operational limit - 22.9 ft;
Supplied by NWS: Action stage-8 ft; Flood stage-10 ft, the Aughwick Creek at Shirleysburg exceeds its banks; several homes are affected; Moderate flood stage-12 ft, flood waters from Aughwick Creek cover portions of Gilbo Road, Aughwick Mills Road and Keystone Road in Shirley Twp; Major flood stage-20 ft;
Summary of all available data for this site
Instantaneous-data availability statement

