USGS 01571005 Paxton Creek near Glenwood, PA

PROVISIONAL DATA SUBJECT TO REVISION

Click to hidestation-specific text
Funding for this site is provided by:


Station gage imageSTATION.--01571005 PAXTON CREEK NEAR GLENWOOD,
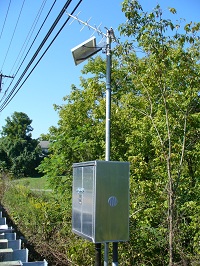
 PA
LOCATION.--Lat 40`18'22", long 76`51'20", Dauphin County, Hydrologic Unit, 02050305, on left bank, downstream side of bridge over Paxton Creek on Kohn Road, near Glenwood, PA.
DRAINAGE AREA.--11.6 square miles.
PERIOD OF RECORD.--September 2012 to current year.
GAGE.--Water-stage recorder and crest-stage gage. Datum of gage is 351.60 ft above North American Vertical Datum of 1988, from survey. Satellite telemetry at gage.
COOPERATION.--Station established and maintained by the U.S. Geological Survey. Funding for the operation of this station is provided by the Susquehanna River Basin Commission.
GAGE HEIGHTS OF IMPORTANCE.--
Supplied by USGS.-- Data transmitter operational limit: 17.2 ft.
This station managed by the PAWSC New Cumberland Office.

Available Parameters Available Period
  
2012-09-13  2024-04-19
2012-09-12  2024-04-19


 (7)
 

  -- or --


Summary of all available data for this site
Instantaneous-data availability statement


Discharge, cubic feet per second

Most recent instantaneous value: 15.1 04-19-2024   20:15 EDT
Graph of  Discharge, cubic feet per second

Add up to 2 more sites and replot for "Discharge, cubic feet per second"

?


Create presentation-quality / stand-alone graph.   Subscribe to WaterAlert      

See this graph on the Monitoring Location Pages


Daily discharge, cubic feet per second -- statistics for Apr 19 based on 11 water years of record more
Min
(2015)
25th
percen-
tile
Most Recent
Instantaneous
Value Apr 19
Median Mean 75th
percen-
tile
Max
(2022)
4.88 7.1 15.1 20 21 33 54.4


Gage height, feet

Most recent instantaneous value: 2.22 04-19-2024   20:15 EDT
Graph of  Gage height, feet

Add up to 2 more sites and replot for "Gage height, feet"

?


Create presentation-quality / stand-alone graph.   Subscribe to WaterAlert      

See this graph on the Monitoring Location Pages