PROVISIONAL DATA SUBJECT TO REVISION
Click to hidestation-specific text
|
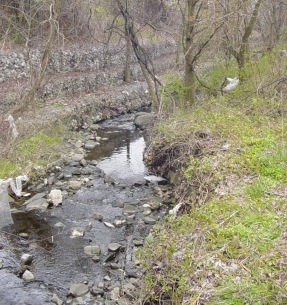 |
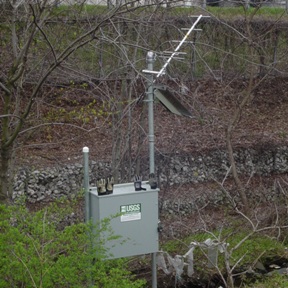
LOCATION.--Lat 39°19'37.2", long 76°44'42.5", Baltimore County, MD, Hydrologic Unit 02060003,
   on right bank, approximately 800 ft downstream from culvert on Rutherford Road, 0.7 mi northwest
   of Woodlawn, 3.0 mi north of Catonsville, and 1.8 mi west of Baltimore City.
DRAINAGE AREA.--0.51 mi2.
PERIOD OF RECORD.--April 2008 to current year. Gage heights only, April 2008 to September 2012, are
   published in WDR-US-2009 through WDR-US-2012.
REVISIONS HISTORY.--https://waterdata.usgs.gov/nwis/dv/?site_no=01589317: 2016-2019.
GAGE.--Water-stage recorder and crest-stage gage. Datum of gage is 400.69 ft above North American
   Vertical Datum of 1988.
REMARKS.--Records are furnished by the University of Maryland, Baltimore County, Center for Urban
   Environmental Research and Education (CUERE). CUERE gage-height telemeter at station. For any
   inquiries or to report malfunctions, please contact Dr. Claire Welty at (410) 455-1766 (weltyc@umbc.edu).
EXTREMES FOR PERIOD OF RECORD.--Maximum discharge, 864 ft³/s, July 30, 2016, gage height, 8.15 ft;
   minimum discharge, 0.01 ft³/s, June 25-27, 29, 30, July 1-10, 2010.
COOPERATION.--Funding for the operation of this station is provided by the National Science Foundation,
   the Center for Urban Environmental Research and Education, University of Maryland
   Baltimore County, and the U.S. Geological Survey.
| Boating safety tips |
Summary of all available data for this site
Instantaneous-data availability statement

