PROVISIONAL DATA SUBJECT TO REVISION
Click to hidestation-specific text
|
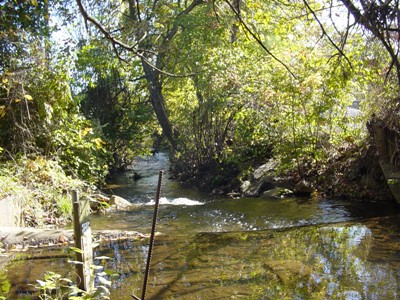 |
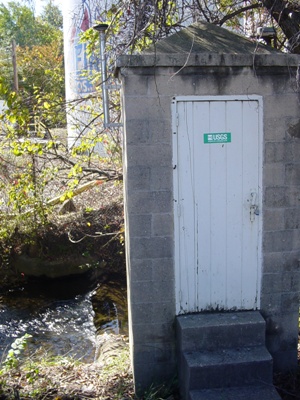
LOCATION.--Lat 39°10'12.0", long 76°37'50.2", Anne Arundel County, MD,
   Hydrologic Unit 02060003, on left bank 300 ft upstream from bridge on State Highway 648, 0.25 mi southeast of
   Interstate Highway 97, and 0.5 mi northwest of Glen Burnie.
DRAINAGE AREA.--4.97 mi2.
PERIOD OF RECORD.--May 1944 to September 1952. Annual maximum, water years 1965-70. September 1983 to current year.
REVISIONS HISTORY.--WDR MD-DE-89-1: 1984-88.
GAGE.--Water-stage recorder, crest-stage gage and concrete control. Datum of gage is 25.28 ft above North American
   Vertical Datum of 1988, from digital elevation model.
REMARKS.--U.S. Geological Survey satellite data-collection platform at station. Low flow affected by groundwater
   diversions from Anne Arundel County municipal well fields upstream from station; spring and summer periods
   affected by discharge and withdrawal from unknown source.
EXTREMES FOR PERIOD OF RECORD.--Maximum discharge, 1,180 ft³/s, Aug. 12, 2014, gage height, 7.61 ft;
   minimum discharge, 0 ft³/s, Sept. 6, 7, 1985, July 29, Aug. 2, 1986.
EXTREMES OUTSIDE PERIOD OF RECORD.--Flood of August 1933 reached a stage of about 4 ft.
COOPERATION.--Funding for the operation of this station is provided by Maryland Geological Survey.
| Boating safety tips |
Summary of all available data for this site
Instantaneous-data availability statement

