USGS 02336526 PROCTOR CREEK AT JACKSON PARKWAY, AT ATLANTA, GA

PROVISIONAL DATA SUBJECT TO REVISION

Click to hidestation-specific text
Atlanta The USGS operation and maintenance of this real-time streamgage and water-quality monitor is funded in cooperation with the City of Atlanta, Georgia.
This station managed by the South Atlantic WSC Atlanta Field Office.

Available Parameters Available Period
  
2007-10-01  2026-03-06
2007-10-01  2026-03-06
2002-12-04  2026-03-06
2007-10-01  2026-03-06
2007-10-01  2026-03-06
2007-10-01  2026-03-06
2007-10-01  2026-03-06
2007-10-04  2026-03-06


 (7)
 

  -- or --


Summary of all available data for this site
Instantaneous-data availability statement
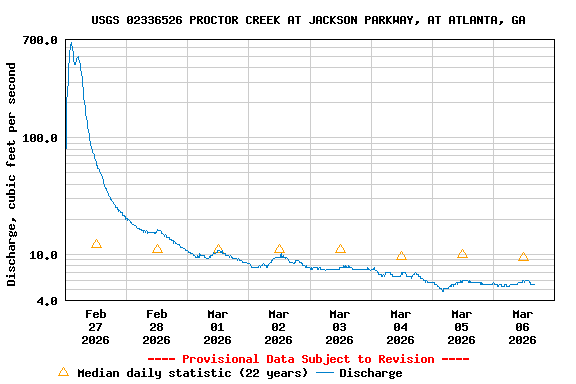
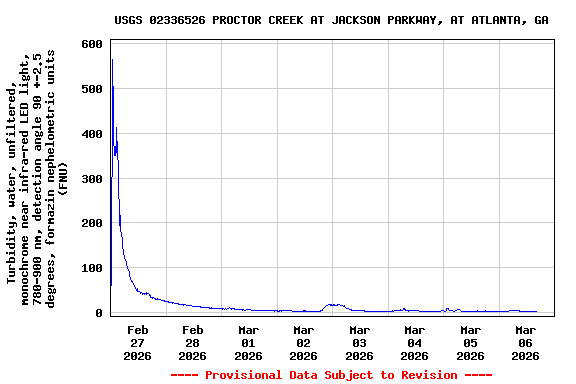

Temperature, water, degrees Celsius

Most recent instantaneous value: 14.2 03-06-2026   09:15 EST
Graph of  Temperature, water, degrees Celsius

Add up to 2 more sites and replot for "Temperature, water, degrees Celsius"

?


Create presentation-quality / stand-alone graph.   Subscribe to WaterAlert      

See this graph on the Monitoring Location Pages


Precipitation, total, inches

Most recent instantaneous value: 0.00 03-06-2026   09:15 EST
Graph of  Precipitation, total, inches

Add up to 2 more sites and replot for "Precipitation, total, inches"

?


Create presentation-quality / stand-alone graph.   Subscribe to WaterAlert      

See this graph on the Monitoring Location Pages


Discharge, cubic feet per second

Most recent instantaneous value: 5.47 03-06-2026   09:15 EST
Graph of  Discharge, cubic feet per second

Add up to 2 more sites and replot for "Discharge, cubic feet per second"

?


Create presentation-quality / stand-alone graph.   Subscribe to WaterAlert      

See this graph on the Monitoring Location Pages


Daily discharge, cubic feet per second -- statistics for Mar 6 based on 22 water years of record more
Min
(2017)
Most Recent
Instantaneous
Value Mar 6
25th
percen-
tile
Median 75th
percen-
tile
Mean Max
(2024)
3.24 5.47 7.5 9.4 18 55 526


Gage height, feet

Most recent instantaneous value: 3.24 03-06-2026   09:15 EST
Graph of  Gage height, feet

Add up to 2 more sites and replot for "Gage height, feet"

?


Create presentation-quality / stand-alone graph.   Subscribe to WaterAlert      

See this graph on the Monitoring Location Pages


Specific conductance, water, unfiltered, microsiemens per centimeter at 25 degrees Celsius

Most recent instantaneous value: 257 03-06-2026   09:15 EST
Graph of  Specific conductance, water, unfiltered, microsiemens per centimeter at 25 degrees Celsius

Add up to 2 more sites and replot for "Specific conductance, water, unfiltered, microsiemens per centimeter at 25 degrees Celsius"

?


Create presentation-quality / stand-alone graph.   Subscribe to WaterAlert      

See this graph on the Monitoring Location Pages


Dissolved oxygen, water, unfiltered, milligrams per liter

Most recent instantaneous value: 9.7 03-06-2026   09:15 EST
Graph of  Dissolved oxygen, water, unfiltered, milligrams per liter

Add up to 2 more sites and replot for "Dissolved oxygen, water, unfiltered, milligrams per liter"

?


Create presentation-quality / stand-alone graph.   Subscribe to WaterAlert      

See this graph on the Monitoring Location Pages


pH, water, unfiltered, field, standard units

Most recent instantaneous value: 7.5 03-06-2026   09:15 EST
Graph of  pH, water, unfiltered, field, standard units

Add up to 2 more sites and replot for "pH, water, unfiltered, field, standard units"

?


Create presentation-quality / stand-alone graph.   Subscribe to WaterAlert      

See this graph on the Monitoring Location Pages


Turbidity, water, unfiltered, monochrome near infra-red LED light, 780-900 nm, detection angle 90 +-2.5 degrees, formazin nephelometric units (FNU)

Most recent instantaneous value: 4.0 03-06-2026   09:15 EST
Graph of  Turbidity, water, unfiltered, monochrome near infra-red LED light, 780-900 nm, detection angle 90 +-2.5 degrees, formazin nephelometric units (FNU)

Add up to 2 more sites and replot for "Turbidity, water, unfiltered, monochrome near infra-red LED light, 780-900 nm, detection angle 90 +-2.5 degrees, formazin nephelometric units (FNU)"

?


Create presentation-quality / stand-alone graph.   Subscribe to WaterAlert      

See this graph on the Monitoring Location Pages