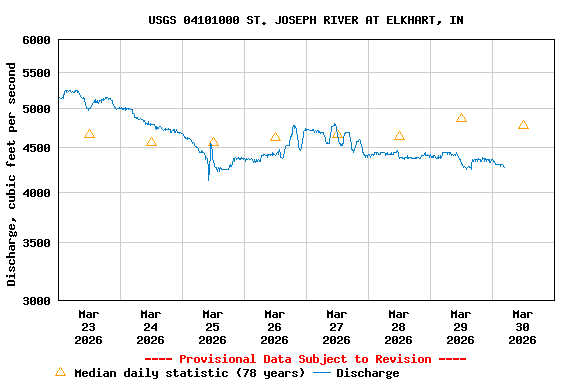
USGS 04101000 ST. JOSEPH RIVER AT ELKHART, IN

PROVISIONAL DATA SUBJECT TO REVISION

Click to hidestation-specific text

Click here to view flood inundation maps for this gaging station.


This gaging station is maintained in cooperation with:

  • The Indiana Department of Natural Resources
  • The USGS Groundwater and Streamflow Information Program (GWSIP)

Boating safety tips
This station managed by the Indiana Water Science Center Office.

Available Parameters Available Period
  
1987-10-01  2026-01-27
2007-10-01  2026-01-27
2023-01-26  2026-01-27


 (7)
 

  -- or --


Summary of all available data for this site
Instantaneous-data availability statement


Discharge, cubic feet per second

Most recent instantaneous value: 2720 01-27-2026   21:30 EST
Graph of  Discharge, cubic feet per second

Add up to 2 more sites and replot for "Discharge, cubic feet per second"

?


Create presentation-quality / stand-alone graph.   Subscribe to WaterAlert      

See this graph on the Monitoring Location Pages


Daily discharge, cubic feet per second -- statistics for Jan 27 based on 78 water years of record more
Min
(1963)
25th
percen-
tile
Most Recent
Instantaneous
Value Jan 27
Median Mean 75th
percen-
tile
Max
(1950)
981 2480 2720 3090 3680 4400 9380


Gage height, feet

Most recent instantaneous value: 19.17 01-27-2026   21:30 EST
Graph of  Gage height, feet

Add up to 2 more sites and replot for "Gage height, feet"

?


Create presentation-quality / stand-alone graph.   Subscribe to WaterAlert      

See this graph on the Monitoring Location Pages


Stream water level elevation above NAVD 1988, in feet

Most recent instantaneous value: 718.72 01-27-2026   21:30 EST
Graph of

Add up to 2 more sites and replot for "Stream water level elevation above NAVD 1988, in feet"

?


Create presentation-quality / stand-alone graph.   Subscribe to WaterAlert      

See this graph on the Monitoring Location Pages