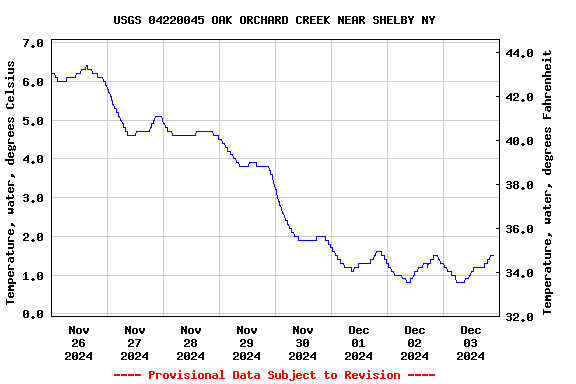
PROVISIONAL DATA SUBJECT TO REVISION
Click to hidestation-specific text
Funding for this site is provided by:
 Site Information
LOCATION.--Lat 43°10'27.5", long
78°23'11.0" referenced to North American Datum of
1983, Orleans County, NY, Hydrologic Unit 04130001, on right
bank, at bridge on Harrison Road, 0.2 mi east of State Highway
63, 1.1 mi south of Shelby, and 4.7 mi upstream from Erie
(Barge) Canal crossing at Medina.
DRAINAGE AREA.--146 mi².
PERIOD OF RECORD.--Occasional discharge measurements, water year 1976. Annual maximum only--1977-78. December 2008 to current year.
GAGE.--Water-stage recorder. Datum of gage is 598.22 ft above NAVD of 1988.
REMARKS.--Water Year 2015: Records good except those for estimated daily discharges, which are fair.
Water Years 2014, 2016-23: Records fair except those for estimated daily discharges, which are poor.
EXTREMES FOR PERIOD OF RECORD.--Maximum discharge, 1,100 ft³/s, Mar. 13, 2011, gage height, 11.21 ft; maximum gage height, 11.33 ft, Feb. 15, 2009 (backwater from ice); minimum discharge, 0.04 ft³/s, Oct. 2, 3, 2016.
PERIOD OF DAILY RECORD1.--WATER TEMPERATURE: July 2020 to current year. SPECIFIC CONDUCTANCE: July 2020 to current year. DISSOLVED OXYGEN: July 2020 to current year. TURBIDITY: July 2020 to current year.
INSTRUMENTATION1.--Multi-parameter water-quality sonde measures water temperature, specific conductance, dissolved oxygen, and turbidity at 15-minute intervals since July 2020.
EXTREMES FOR PERIOD OF DAILY RECORD1.--WATER TEMPERATURE: Maximum, 29.0°C, July 10, 2020; minimum, -0.1°C, on many days.
SPECIFIC CONDUCTANCE: Maximum, 2,520 uS/cm @ 25°C, Aug. 11, 12, 2022; minimum, 483 uS/cm @ 25°C, Feb. 23, 2022.
DISSOLVED OXYGEN: Maximum, 16.1 mg/L, June 21, 2022; minimum, 2.1 mg/L, July 28, 2021.
TURBIDITY: Maximum, 550 FNU, July 8, 2021; minimum, 1.1 FNU, July 27, 2021.
1 Water-Quality Records
 WaterAlert – get an
email or text (SMS) alert based on your chosen threshold.
WaterAlert – get an
email or text (SMS) alert based on your chosen threshold.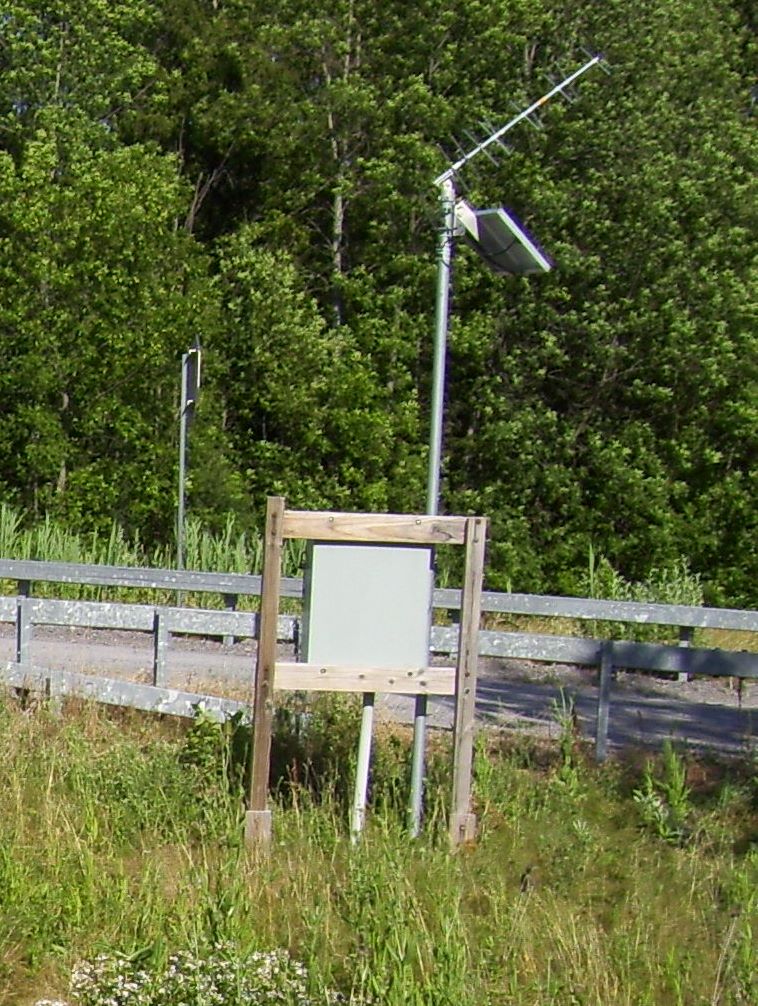 Station image
Summary of all available data for this site
Instantaneous-data availability statement