PROVISIONAL DATA SUBJECT TO REVISION
Click to hidestation-specific text
Funding for this site is provided by:
 Site Information
LOCATION.--Lat 43°32'32.5", long
75°48'50.3" referenced to North American Datum of
1983, Oswego County, NY, Hydrologic Unit 04140102, at bridge on
Harvester Mill Road, 0.7 mi northeast of Redfield, and 0.8 mi
upstream from mouth.
DRAINAGE AREA.--82.5 mi².
PERIOD OF RECORD.--Occasional miscellaneous discharge measurements, water years 1957, 1959-64, annual maximum only--1962-64, 1985, 1987-2013. October 2013 to current year.
GAGE.--Water-stage recorder and crest-stage gage. Datum of gage is 948.45 ft above NAVD of 1988. Prior to Oct. 30, 2013, nonrecording gage at present site at datum 9.00 ft lower, and prior to Oct. 1, 1984, at different datum.
REMARKS.--Water Years 2014-24: Records good except those for estimated daily discharges, which are poor.
EXTREMES FOR PERIOD OF RECORD.--Maximum discharge, 16,700 ft³/s, Apr. 29, 2011, gage height, 10.84 ft, present datum, from rating curve extended above 5,800 ft³/s on basis of contracted-opening and flow-through-culverts measurement at gage height 10.15 ft; minimum discharge, 2.9 ft³/s, July 31, Aug. 1, 2016, gage height, 0.47 ft.
 WaterAlert – get an
email or text (SMS) alert based on your chosen threshold.
WaterAlert – get an
email or text (SMS) alert based on your chosen threshold.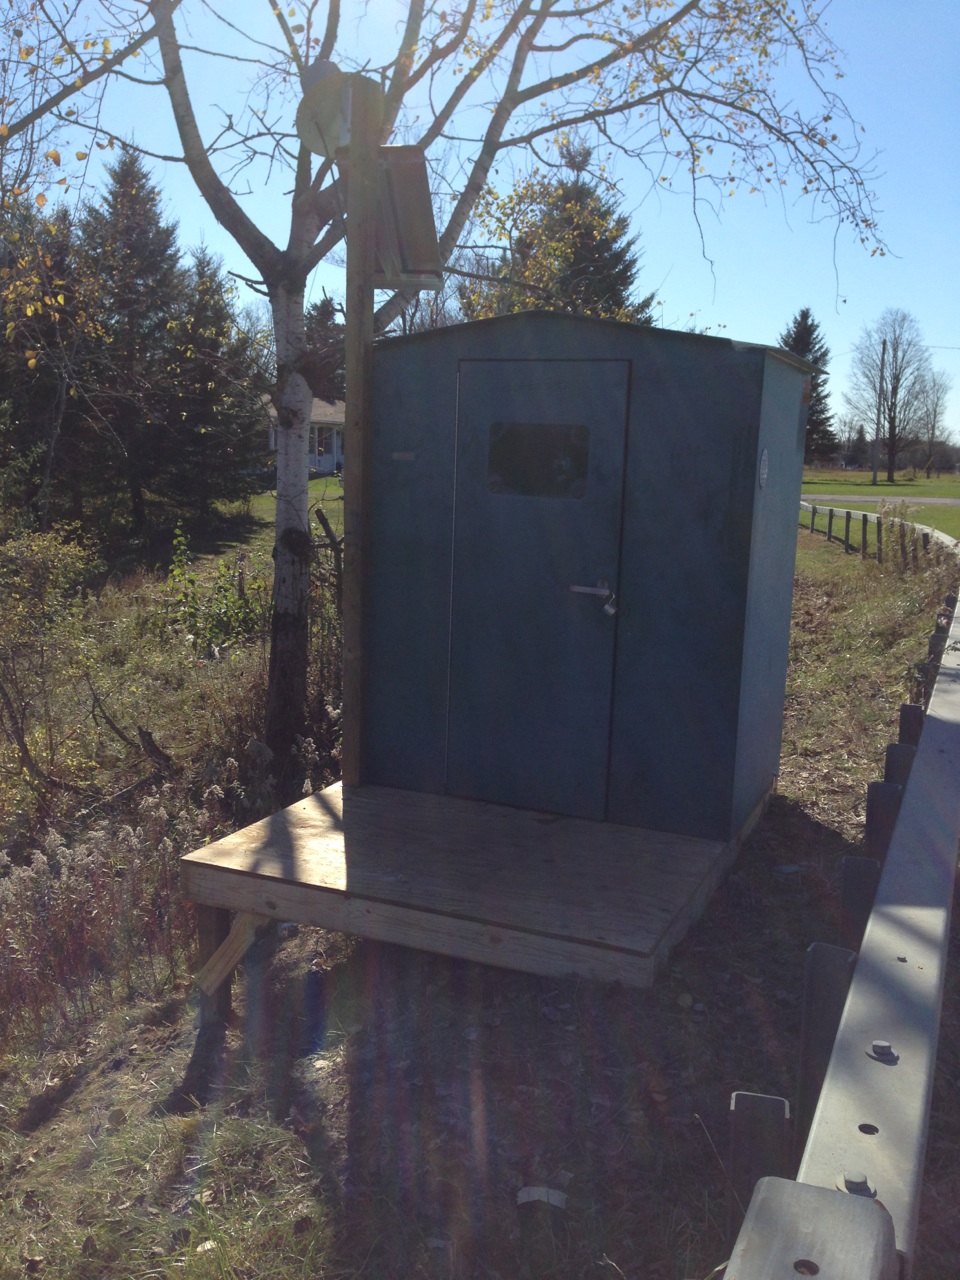 Station image
Summary of all available data for this site
Instantaneous-data availability statement

