USGS 06174500 Milk River at Nashua MT

PROVISIONAL DATA SUBJECT TO REVISION

Click to hidestation-specific text
Flood Tracking - Stage Flood Tracking - Discharge Gage-height Corrections Base Rating Shifted Rating
(About shift-adjusted ratings).
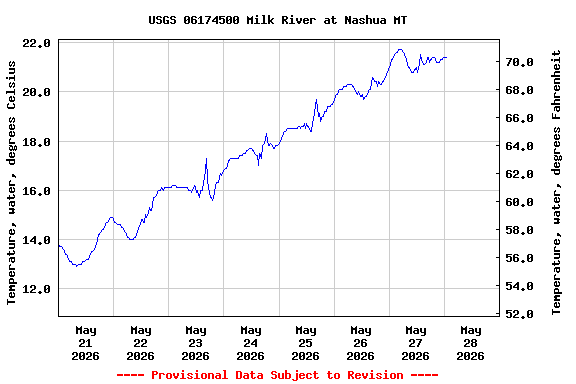
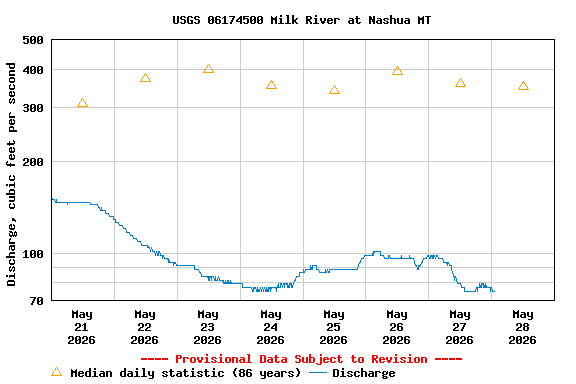
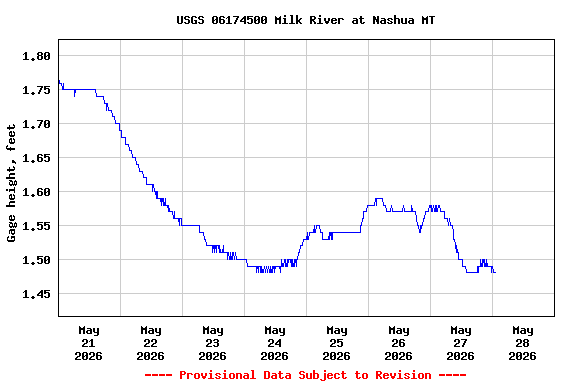
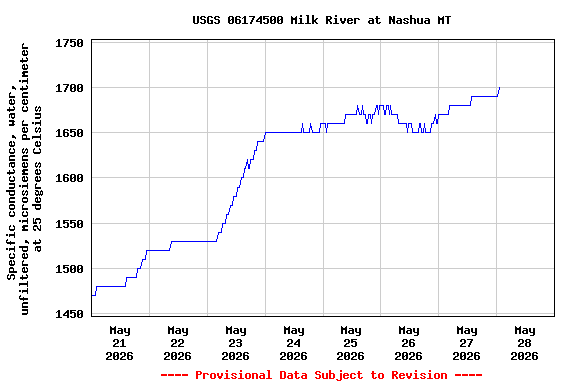
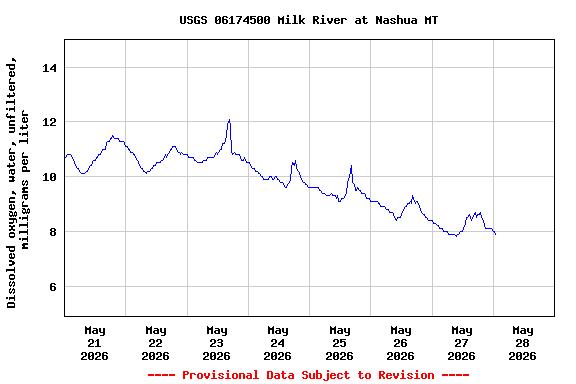
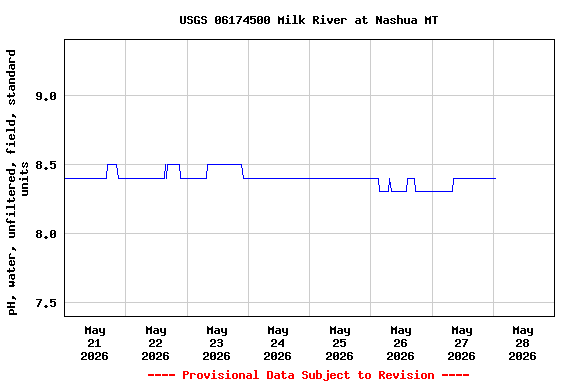
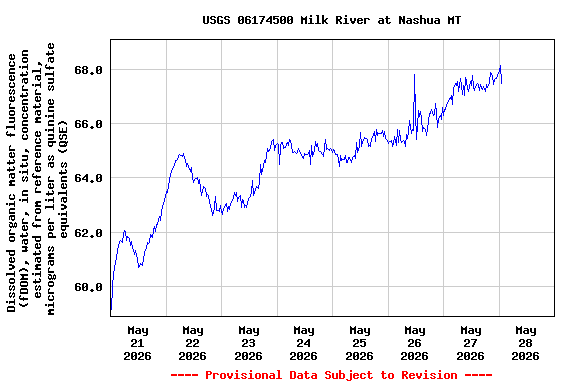
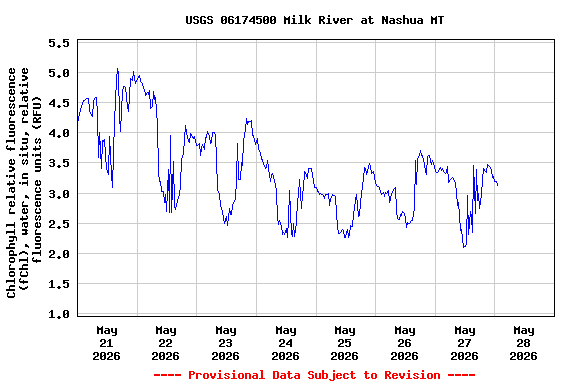
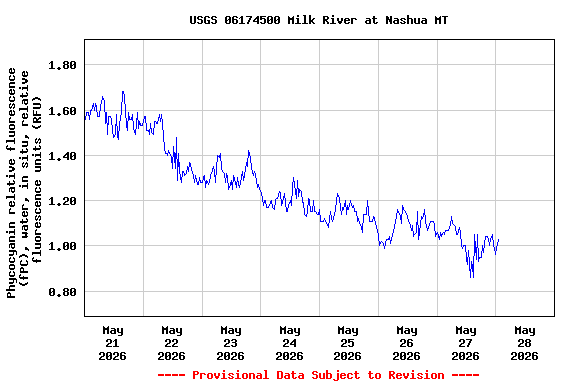
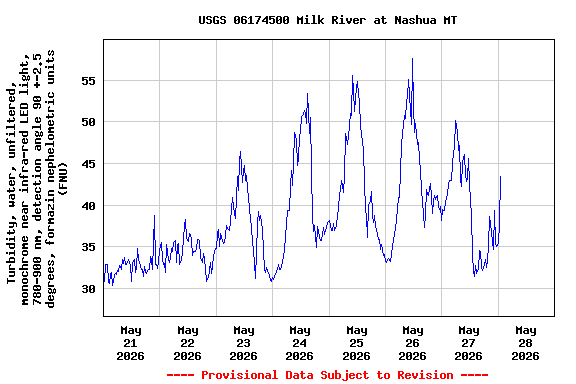
Station operated by the USGS Wyoming-Montana Water Science Center in cooperation with U.S. Army Corps of Engineers.
Leaving USGS: National Weather Service forecast. U.S. Coast Guard boating safety tips.
This station managed by the Billings Field Unit.

Available Parameters Available Period
  
2024-04-24  2024-04-25
1989-10-01  2024-04-25
2007-10-01  2024-04-25
2024-04-24  2024-04-25
2024-04-24  2024-04-25
2024-04-24  2024-04-25
2024-04-24  2024-04-25
2024-04-24  2024-04-25
2024-04-24  2024-04-25
2024-04-24  2024-04-25
2024-04-24  2024-04-25


 (7)
 

  -- or --


Summary of all available data for this site
Instantaneous-data availability statement


Temperature, water, degrees Celsius

Most recent instantaneous value: 13.4 04-25-2024   22:00 MDT
Graph of

Add up to 2 more sites and replot for "Temperature, water, degrees Celsius"

?


Create presentation-quality / stand-alone graph.   Subscribe to WaterAlert      

See this graph on the Monitoring Location Pages


Discharge, cubic feet per second

Most recent instantaneous value: 277 04-25-2024   22:00 MDT
Graph of  Discharge, cubic feet per second

Add up to 2 more sites and replot for "Discharge, cubic feet per second"

?


Create presentation-quality / stand-alone graph.   Subscribe to WaterAlert      

See this graph on the Monitoring Location Pages


Daily discharge, cubic feet per second -- statistics for Apr 26 based on 84 water years of record more
Min
(1985)
25th
percen-
tile
Median Most Recent
Instantaneous
Value Apr 26
75th
percen-
tile
Mean Max
(1952)
4.97 78 274 277 1420 1550 20200


Gage height, feet

Most recent instantaneous value: 2.27 04-25-2024   22:00 MDT
Graph of  Gage height, feet

Add up to 2 more sites and replot for "Gage height, feet"

?


Create presentation-quality / stand-alone graph.   Subscribe to WaterAlert      

See this graph on the Monitoring Location Pages


Oxidation reduction potential, reference electrode not specified, millivolts

Most recent instantaneous value: 194 04-25-2024   22:00 MDT
Graph of  Oxidation reduction potential, reference electrode not specified, millivolts

Add up to 2 more sites and replot for "Oxidation reduction potential, reference electrode not specified, millivolts"

?


Create presentation-quality / stand-alone graph.   Subscribe to WaterAlert      

See this graph on the Monitoring Location Pages


Specific conductance, water, unfiltered, microsiemens per centimeter at 25 degrees Celsius

Most recent instantaneous value: 798 04-25-2024   22:00 MDT
Graph of

Add up to 2 more sites and replot for "Specific conductance, water, unfiltered, microsiemens per centimeter at 25 degrees Celsius"

?


Create presentation-quality / stand-alone graph.   Subscribe to WaterAlert      

See this graph on the Monitoring Location Pages


Dissolved oxygen, water, unfiltered, milligrams per liter

Most recent instantaneous value: 10.7 04-25-2024   22:00 MDT
Graph of

Add up to 2 more sites and replot for "Dissolved oxygen, water, unfiltered, milligrams per liter"

?


Create presentation-quality / stand-alone graph.   Subscribe to WaterAlert      

See this graph on the Monitoring Location Pages


pH, water, unfiltered, field, standard units

Most recent instantaneous value: 8.2 04-25-2024   22:00 MDT
Graph of

Add up to 2 more sites and replot for "pH, water, unfiltered, field, standard units"

?


Create presentation-quality / stand-alone graph.   Subscribe to WaterAlert      

See this graph on the Monitoring Location Pages


Dissolved organic matter fluorescence (fDOM), water, in situ, concentration estimated from reference material, micrograms per liter as quinine sulfate equivalents (QSE)

Most recent instantaneous value: 80.52 04-25-2024   22:00 MDT
Graph of  Dissolved organic matter fluorescence (fDOM), water, in situ, concentration estimated from reference material, micrograms per liter as quinine sulfate equivalents (QSE)

Add up to 2 more sites and replot for "Dissolved organic matter fluorescence (fDOM), water, in situ, concentration estimated from reference material, micrograms per liter as quinine sulfate equivalents (QSE)"

?


Create presentation-quality / stand-alone graph.   Subscribe to WaterAlert      

See this graph on the Monitoring Location Pages


Chlorophyll relative fluorescence (fChl), water, in situ, relative fluorescence units (RFU)

Most recent instantaneous value: 3.25 04-25-2024   22:00 MDT
Graph of  Chlorophyll relative fluorescence (fChl), water, in situ, relative fluorescence units (RFU)

Add up to 2 more sites and replot for "Chlorophyll relative fluorescence (fChl), water, in situ, relative fluorescence units (RFU)"

?


Create presentation-quality / stand-alone graph.   Subscribe to WaterAlert      

See this graph on the Monitoring Location Pages


Phycocyanin relative fluorescence (fPC), water, in situ, relative fluorescence units (RFU)

Most recent instantaneous value: 1.31 04-25-2024   22:00 MDT
Graph of  Phycocyanin relative fluorescence (fPC), water, in situ, relative fluorescence units (RFU)

Add up to 2 more sites and replot for "Phycocyanin relative fluorescence (fPC), water, in situ, relative fluorescence units (RFU)"

?


Create presentation-quality / stand-alone graph.   Subscribe to WaterAlert      

See this graph on the Monitoring Location Pages


Turbidity, water, unfiltered, monochrome near infra-red LED light, 780-900 nm, detection angle 90 +-2.5 degrees, formazin nephelometric units (FNU)

Most recent instantaneous value: 41.6 04-25-2024   22:00 MDT
Graph of  Turbidity, water, unfiltered, monochrome near infra-red LED light, 780-900 nm, detection angle 90 +-2.5 degrees, formazin nephelometric units (FNU)

Add up to 2 more sites and replot for "Turbidity, water, unfiltered, monochrome near infra-red LED light, 780-900 nm, detection angle 90 +-2.5 degrees, formazin nephelometric units (FNU)"

?


Create presentation-quality / stand-alone graph.   Subscribe to WaterAlert      

See this graph on the Monitoring Location Pages