PROVISIONAL DATA SUBJECT TO REVISION
Click to hidestation-specific text
This station is operated in
cooperation with the following:  |
Summary of all available data for this site
Instantaneous-data availability statement
|
This station is operated in
cooperation with the following: |
Temperature, water, degrees Celsius |
||
|
||

| Min (1961) | 25th percen- tile | Median | Most Recent Instantaneous Value May 28 | 75th percen- tile | Mean | Max (2011) |
|---|---|---|---|---|---|---|
| 6.00 | 12 | 16 | 17.3 | 24 | 27 | 224 |
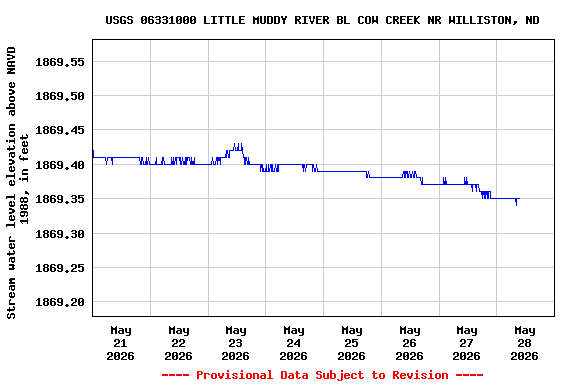
![Graph of Gage height, feet, [Bubbler]](https://natwebcaww02.wr.usgs.gov/nwisweb/data/img/USGS.06331000.92674.00065..20260521.20260528..0..gif)
Specific conductance, water, unfiltered, microsiemens per centimeter at 25 degrees Celsius |
||
|
||
![]() U.S. Department of the Interior |
U.S. Geological Survey
U.S. Department of the Interior |
U.S. Geological Survey
Title: USGS Current Conditions for the Nation
URL:
Page Contact Information: North Dakota Water Data Support Team
Page Last Modified: 2026-05-28 10:40:07 EDT
2.89 2.28 caww02