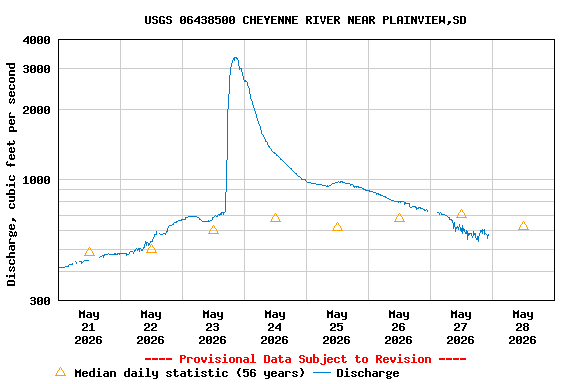
USGS 06438500 CHEYENNE RIVER NEAR PLAINVIEW,SD

PROVISIONAL DATA SUBJECT TO REVISION

Click to hidestation-specific text
  This station is operated in cooperation with the:

Army Cops of Engineers
Omaha District

The precipitation data for this station are temporary and will only be displayed for 120 days. Time series values will NOT be available for retrieval following the 120-day display period. Rainfall instrumentation may not be calibrated, and other quality assurance measures may not be performed that would make the data acceptable for archival, retrieval, or future use in general scientific or interpretive studies.
Boating safety tips
This station managed by the Rapid City Office of the Dakota Science Center.

Available Parameters Available Period
  
2023-11-29  2024-03-28
1996-10-01  2024-03-28
2018-05-01  2024-03-28


 (7)
 

  -- or --


Summary of all available data for this site
Instantaneous-data availability statement


Temperature, water, degrees Celsius

Most recent instantaneous value: 1.9 03-28-2024   05:30 MDT
Graph of  Temperature, water, degrees Celsius

Add up to 2 more sites and replot for "Temperature, water, degrees Celsius"

?


Create presentation-quality / stand-alone graph.   Subscribe to WaterAlert      

See this graph on the Monitoring Location Pages


Discharge, cubic feet per second

Most recent instantaneous value: 204 03-28-2024   05:30 MDT
Graph of  Discharge, cubic feet per second

Add up to 2 more sites and replot for "Discharge, cubic feet per second"

?


Create presentation-quality / stand-alone graph.   Subscribe to WaterAlert      

See this graph on the Monitoring Location Pages


Daily discharge, cubic feet per second -- statistics for Mar 28 based on 55 water years of record more
Min
(1961)
Most Recent
Instantaneous
Value Mar 28
25th
percen-
tile
Median Mean 75th
percen-
tile
Max
(2019)
82.0 204 254 450 1010 1130 9990


Gage height, feet

Most recent instantaneous value: 8.52 03-28-2024   05:30 MDT
Graph of  Gage height, feet

Add up to 2 more sites and replot for "Gage height, feet"

?


Create presentation-quality / stand-alone graph.   Subscribe to WaterAlert      

See this graph on the Monitoring Location Pages