USGS 06805500 Platte River at Louisville, Nebr.

PROVISIONAL DATA SUBJECT TO REVISION

Click to hidestation-specific text
> WaterNow – get the latest gage data from your mobile phone or email.

> Rating Information

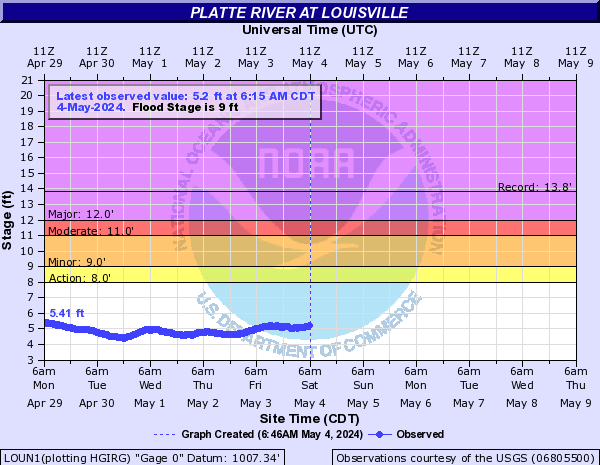
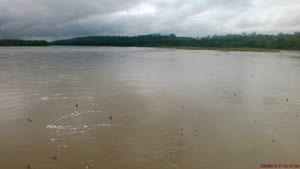
Downstream view near USGS gaging station: Platte River at Louisville, Nebr.

Upstream Platte River Basin
(Salt Creek-mouth)
Downstream

This station managed by the Lincoln Field Office.

Available Parameters Available Period
  
2007-05-16  2026-06-09
1988-10-01  2026-06-09
2007-10-01  2026-06-09
2007-05-18  2026-06-09
2007-05-18  2026-06-09
2012-06-05  2026-06-09
2007-05-18  2026-06-09


 (7)
 

  -- or --


Summary of all available data for this site
Instantaneous-data availability statement


Temperature, water, degrees Celsius

Most recent instantaneous value: 29.7 06-09-2026   13:15 CDT
Graph of  Temperature, water, degrees Celsius

Add up to 2 more sites and replot for "Temperature, water, degrees Celsius"

?


Create presentation-quality / stand-alone graph.   Subscribe to WaterAlert      

See this graph on the Monitoring Location Pages


Discharge, cubic feet per second

Most recent instantaneous value: 7400 06-09-2026   13:15 CDT
Graph of  Discharge, cubic feet per second

Add up to 2 more sites and replot for "Discharge, cubic feet per second"

?


Create presentation-quality / stand-alone graph.   Subscribe to WaterAlert      

See this graph on the Monitoring Location Pages


Daily discharge, cubic feet per second -- statistics for Jun 9 based on 73 water years of record more
Min
(2006)
25th
percen-
tile
Most Recent
Instantaneous
Value Jun 9
Median Mean 75th
percen-
tile
Max
(2008)
2350 4990 7400 8400 11400 14200 52400


Gage height, feet, [Primary Stage Sensor]

Most recent instantaneous value: 3.93 06-09-2026   13:15 CDT
Graph of  Gage height, feet, [Primary Stage Sensor]

Add up to 2 more sites and replot for "Gage height, feet, [Primary Stage Sensor]"

?


Create presentation-quality / stand-alone graph.   Subscribe to WaterAlert      

See this graph on the Monitoring Location Pages


Specific conductance, water, unfiltered, microsiemens per centimeter at 25 degrees Celsius

Most recent instantaneous value: 505 06-09-2026   13:15 CDT
Graph of  Specific conductance, water, unfiltered, microsiemens per centimeter at 25 degrees Celsius

Add up to 2 more sites and replot for "Specific conductance, water, unfiltered, microsiemens per centimeter at 25 degrees Celsius"

?


Create presentation-quality / stand-alone graph.   Subscribe to WaterAlert      

See this graph on the Monitoring Location Pages


Dissolved oxygen, water, unfiltered, milligrams per liter

Most recent instantaneous value: 9.2 06-09-2026   13:15 CDT
Graph of  Dissolved oxygen, water, unfiltered, milligrams per liter

Add up to 2 more sites and replot for "Dissolved oxygen, water, unfiltered, milligrams per liter"

?


Create presentation-quality / stand-alone graph.   Subscribe to WaterAlert      

See this graph on the Monitoring Location Pages


Nitrate plus nitrite, water, unfiltered, milligrams per liter as nitrogen

Most recent instantaneous value: 0.50 06-09-2026   13:15 CDT
Graph of  Nitrate plus nitrite, water, unfiltered, milligrams per liter as nitrogen

Add up to 2 more sites and replot for "Nitrate plus nitrite, water, unfiltered, milligrams per liter as nitrogen"

?


Create presentation-quality / stand-alone graph.   Subscribe to WaterAlert      

See this graph on the Monitoring Location Pages


Turbidity, water, unfiltered, monochrome near infra-red LED light, 780-900 nm, detection angle 90 +-2.5 degrees, formazin nephelometric units (FNU)

Most recent instantaneous value: 85.3 06-09-2026   13:15 CDT
Graph of  Turbidity, water, unfiltered, monochrome near infra-red LED light, 780-900 nm, detection angle 90 +-2.5 degrees, formazin nephelometric units (FNU)

Add up to 2 more sites and replot for "Turbidity, water, unfiltered, monochrome near infra-red LED light, 780-900 nm, detection angle 90 +-2.5 degrees, formazin nephelometric units (FNU)"

?


Create presentation-quality / stand-alone graph.   Subscribe to WaterAlert      

See this graph on the Monitoring Location Pages