USGS 06811500 Little Nemaha River at Auburn, Nebr.

PROVISIONAL DATA SUBJECT TO REVISION

Click to hidestation-specific text
Funding for this site is provided by
logo logo
Omaha District National Streamflow
Information Program
> WaterNow – get the latest gage data from your mobile phone or email.

> Rating Information

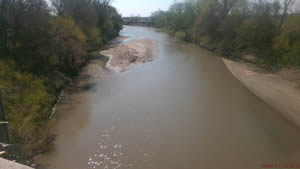
Downstream view near USGS gaging station: Little Nemaha River at Auburn, Nebr.

Upstream Missouri River Basin
(below Platte River)
Downstream

This station managed by the Lincoln Field Office.

Available Parameters Available Period
  
2025-06-08  2025-10-06
1990-10-01  2025-10-06
2007-10-01  2025-10-06


 (7)
 

  -- or --


Summary of all available data for this site
Instantaneous-data availability statement


Temperature, air, degrees Celsius

Most recent instantaneous value: 12.1 10-06-2025   23:15 CDT
Graph of

Add up to 2 more sites and replot for "Temperature, air, degrees Celsius"

?


Create presentation-quality / stand-alone graph.   Subscribe to WaterAlert      

See this graph on the Monitoring Location Pages


Discharge, cubic feet per second, [Discharge from Primary Sensor]

Most recent instantaneous value: 2670 10-06-2025   23:15 CDT
Graph of  Discharge, cubic feet per second, [Discharge from Primary Sensor]

Add up to 2 more sites and replot for "Discharge, cubic feet per second, [Discharge from Primary Sensor]"

?


Create presentation-quality / stand-alone graph.   Subscribe to WaterAlert      

See this graph on the Monitoring Location Pages


Daily discharge, cubic feet per second -- statistics for Oct 7 based on 76 water years of record more
Min
(1957)
25th
percen-
tile
Median 75th
percen-
tile
Mean Most Recent
Instantaneous
Value Oct 7
Max
(2018)
12.0 35 83 162 286 2670 7940


Gage height, feet, [Primary Stage Sensor]

Most recent instantaneous value: 9.57 10-06-2025   23:15 CDT
Graph of  Gage height, feet, [Primary Stage Sensor]

Add up to 2 more sites and replot for "Gage height, feet, [Primary Stage Sensor]"

?


Create presentation-quality / stand-alone graph.   Subscribe to WaterAlert      

See this graph on the Monitoring Location Pages