USGS 07048550 West Fork White River east of Fayetteville, AR

PROVISIONAL DATA SUBJECT TO REVISION

Click to hidestation-specific text
> WaterNow – get the latest gage data from your mobile phone or email.
> Rating Information
This station managed by the Fayetteville Office.

Available Parameters Available Period
  
2014-10-11  2024-03-28
2001-09-19  2024-03-28
2007-10-01  2024-03-28
2014-10-12  2024-03-28
2014-10-11  2024-03-28
2023-11-29  2024-03-28


 (7)
 

  -- or --


Summary of all available data for this site
Instantaneous-data availability statement
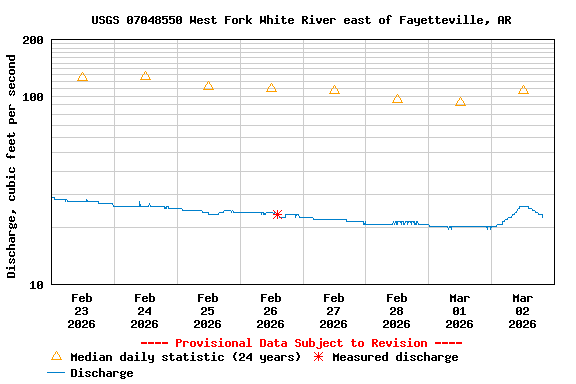

Temperature, water, degrees Celsius

Most recent instantaneous value: 10.9 03-28-2024   02:30 CDT
Graph of  Temperature, water, degrees Celsius

Add up to 2 more sites and replot for "Temperature, water, degrees Celsius"

?


Create presentation-quality / stand-alone graph.   Subscribe to WaterAlert      

See this graph on the Monitoring Location Pages


Discharge, cubic feet per second

Most recent instantaneous value: 458 03-28-2024   02:30 CDT
Graph of  Discharge, cubic feet per second

Add up to 2 more sites and replot for "Discharge, cubic feet per second"

?


Create presentation-quality / stand-alone graph.   Subscribe to WaterAlert      

See this graph on the Monitoring Location Pages


Daily discharge, cubic feet per second -- statistics for Mar 28 based on 22 water years of record more
Min
(2007)
25th
percen-
tile
Median Mean 75th
percen-
tile
Most Recent
Instantaneous
Value Mar 28
Max
(2018)
22.9 97 280 401 454 458 2300


Gage height, feet

Most recent instantaneous value: 4.27 03-28-2024   02:30 CDT
Graph of  Gage height, feet

Add up to 2 more sites and replot for "Gage height, feet"

?


Create presentation-quality / stand-alone graph.   Subscribe to WaterAlert      

See this graph on the Monitoring Location Pages


Specific conductance, water, unfiltered, microsiemens per centimeter at 25 degrees Celsius

Most recent instantaneous value: 128 03-28-2024   02:30 CDT
Graph of  Specific conductance, water, unfiltered, microsiemens per centimeter at 25 degrees Celsius

Add up to 2 more sites and replot for "Specific conductance, water, unfiltered, microsiemens per centimeter at 25 degrees Celsius"

?


Create presentation-quality / stand-alone graph.   Subscribe to WaterAlert      

See this graph on the Monitoring Location Pages


Turbidity, water, unfiltered, monochrome near infra-red LED light, 780-900 nm, detection angle 90 +-2.5 degrees, formazin nephelometric units (FNU)

Most recent instantaneous value: 35.2 03-28-2024   02:30 CDT
Graph of  Turbidity, water, unfiltered, monochrome near infra-red LED light, 780-900 nm, detection angle 90 +-2.5 degrees, formazin nephelometric units (FNU)

Add up to 2 more sites and replot for "Turbidity, water, unfiltered, monochrome near infra-red LED light, 780-900 nm, detection angle 90 +-2.5 degrees, formazin nephelometric units (FNU)"

?


Create presentation-quality / stand-alone graph.   Subscribe to WaterAlert      

See this graph on the Monitoring Location Pages


Suspended sediment concentration, water, unfiltered, at a fixed point in stream, estimated by a regression equation with turbidity, milligrams per liter

Most recent instantaneous value: 52.9 03-28-2024   02:30 CDT
Graph of  Suspended sediment concentration, water, unfiltered, at a fixed point in stream, estimated by a regression equation with turbidity, milligrams per liter

Add up to 2 more sites and replot for "Suspended sediment concentration, water, unfiltered, at a fixed point in stream, estimated by a regression equation with turbidity, milligrams per liter"

?


Create presentation-quality / stand-alone graph.   Subscribe to WaterAlert      

See this graph on the Monitoring Location Pages