USGS 11261500 SAN JOAQUIN R A FREMONT FORD BRIDGE CA

PROVISIONAL DATA SUBJECT TO REVISION

Click to hidestation-specific text
Click to enlarge
Site Photo
> Rating Information
This station managed by the Sacramento Field Office.

Available Parameters Available Period
  
2007-10-01  2026-03-04
1988-10-01  2026-03-04
2007-10-01  2026-03-04
2007-10-01  2026-03-04
2023-05-03  2026-03-04


 (7)
 

  -- or --


Summary of all available data for this site
Instantaneous-data availability statement
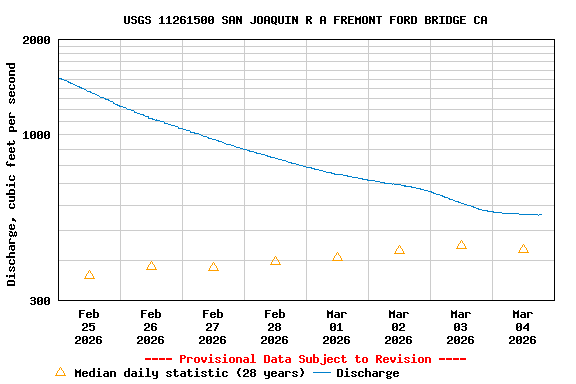

Temperature, water, degrees Celsius

Most recent instantaneous value: 18.4 03-04-2026   19:00 PST
Graph of  Temperature, water, degrees Celsius

Add up to 2 more sites and replot for "Temperature, water, degrees Celsius"

?


Create presentation-quality / stand-alone graph.   Subscribe to WaterAlert      

See this graph on the Monitoring Location Pages


Discharge, cubic feet per second

Most recent instantaneous value: 560 03-04-2026   19:00 PST
Graph of  Discharge, cubic feet per second

Add up to 2 more sites and replot for "Discharge, cubic feet per second"

?


Create presentation-quality / stand-alone graph.   Subscribe to WaterAlert      

See this graph on the Monitoring Location Pages


Daily discharge, cubic feet per second -- statistics for Mar 4 based on 28 water years of record more
Min
(2015)
25th
percen-
tile
Median Most Recent
Instantaneous
Value Mar 4
75th
percen-
tile
Mean Max
(2017)
108 285 436 560 1260 1380 13400


Gage height, feet

Most recent instantaneous value: 61.92 03-04-2026   19:00 PST
Graph of  Gage height, feet

Add up to 2 more sites and replot for "Gage height, feet"

?


Create presentation-quality / stand-alone graph.   Subscribe to WaterAlert      

See this graph on the Monitoring Location Pages


Specific conductance, water, unfiltered, microsiemens per centimeter at 25 degrees Celsius

Most recent instantaneous value: 1050 03-04-2026   19:00 PST
Graph of  Specific conductance, water, unfiltered, microsiemens per centimeter at 25 degrees Celsius

Add up to 2 more sites and replot for "Specific conductance, water, unfiltered, microsiemens per centimeter at 25 degrees Celsius"

?


Create presentation-quality / stand-alone graph.   Subscribe to WaterAlert      

See this graph on the Monitoring Location Pages


Stream water level elevation above NAVD 1988, in feet

Most recent instantaneous value: 61.43 03-04-2026   19:00 PST
Graph of  Stream water level elevation above NAVD 1988, in feet

Add up to 2 more sites and replot for "Stream water level elevation above NAVD 1988, in feet"

?


Create presentation-quality / stand-alone graph.   Subscribe to WaterAlert      

See this graph on the Monitoring Location Pages